

Spatial transcriptomics is a powerful approach for studying how cells behave within intact tissues. By measuring where RNA molecules are located inside a tissue, scientists can connect gene activity to specific cell types and their surrounding environment. Imaging-based spatial methods are especially attractive because they can capture molecular information at very high resolution, sometimes down to individual molecules inside cells.
A major challenge, however, lies in correctly defining the boundaries of each cell. This step, called cell segmentation, determines which RNA molecules belong to which cell. A team led by researchers at Harvard Medical School examined spatial transcriptomics datasets from multiple tissues and experimental platforms to understand how segmentation errors affect results.
Segmentation errors confound context-dependent DE results
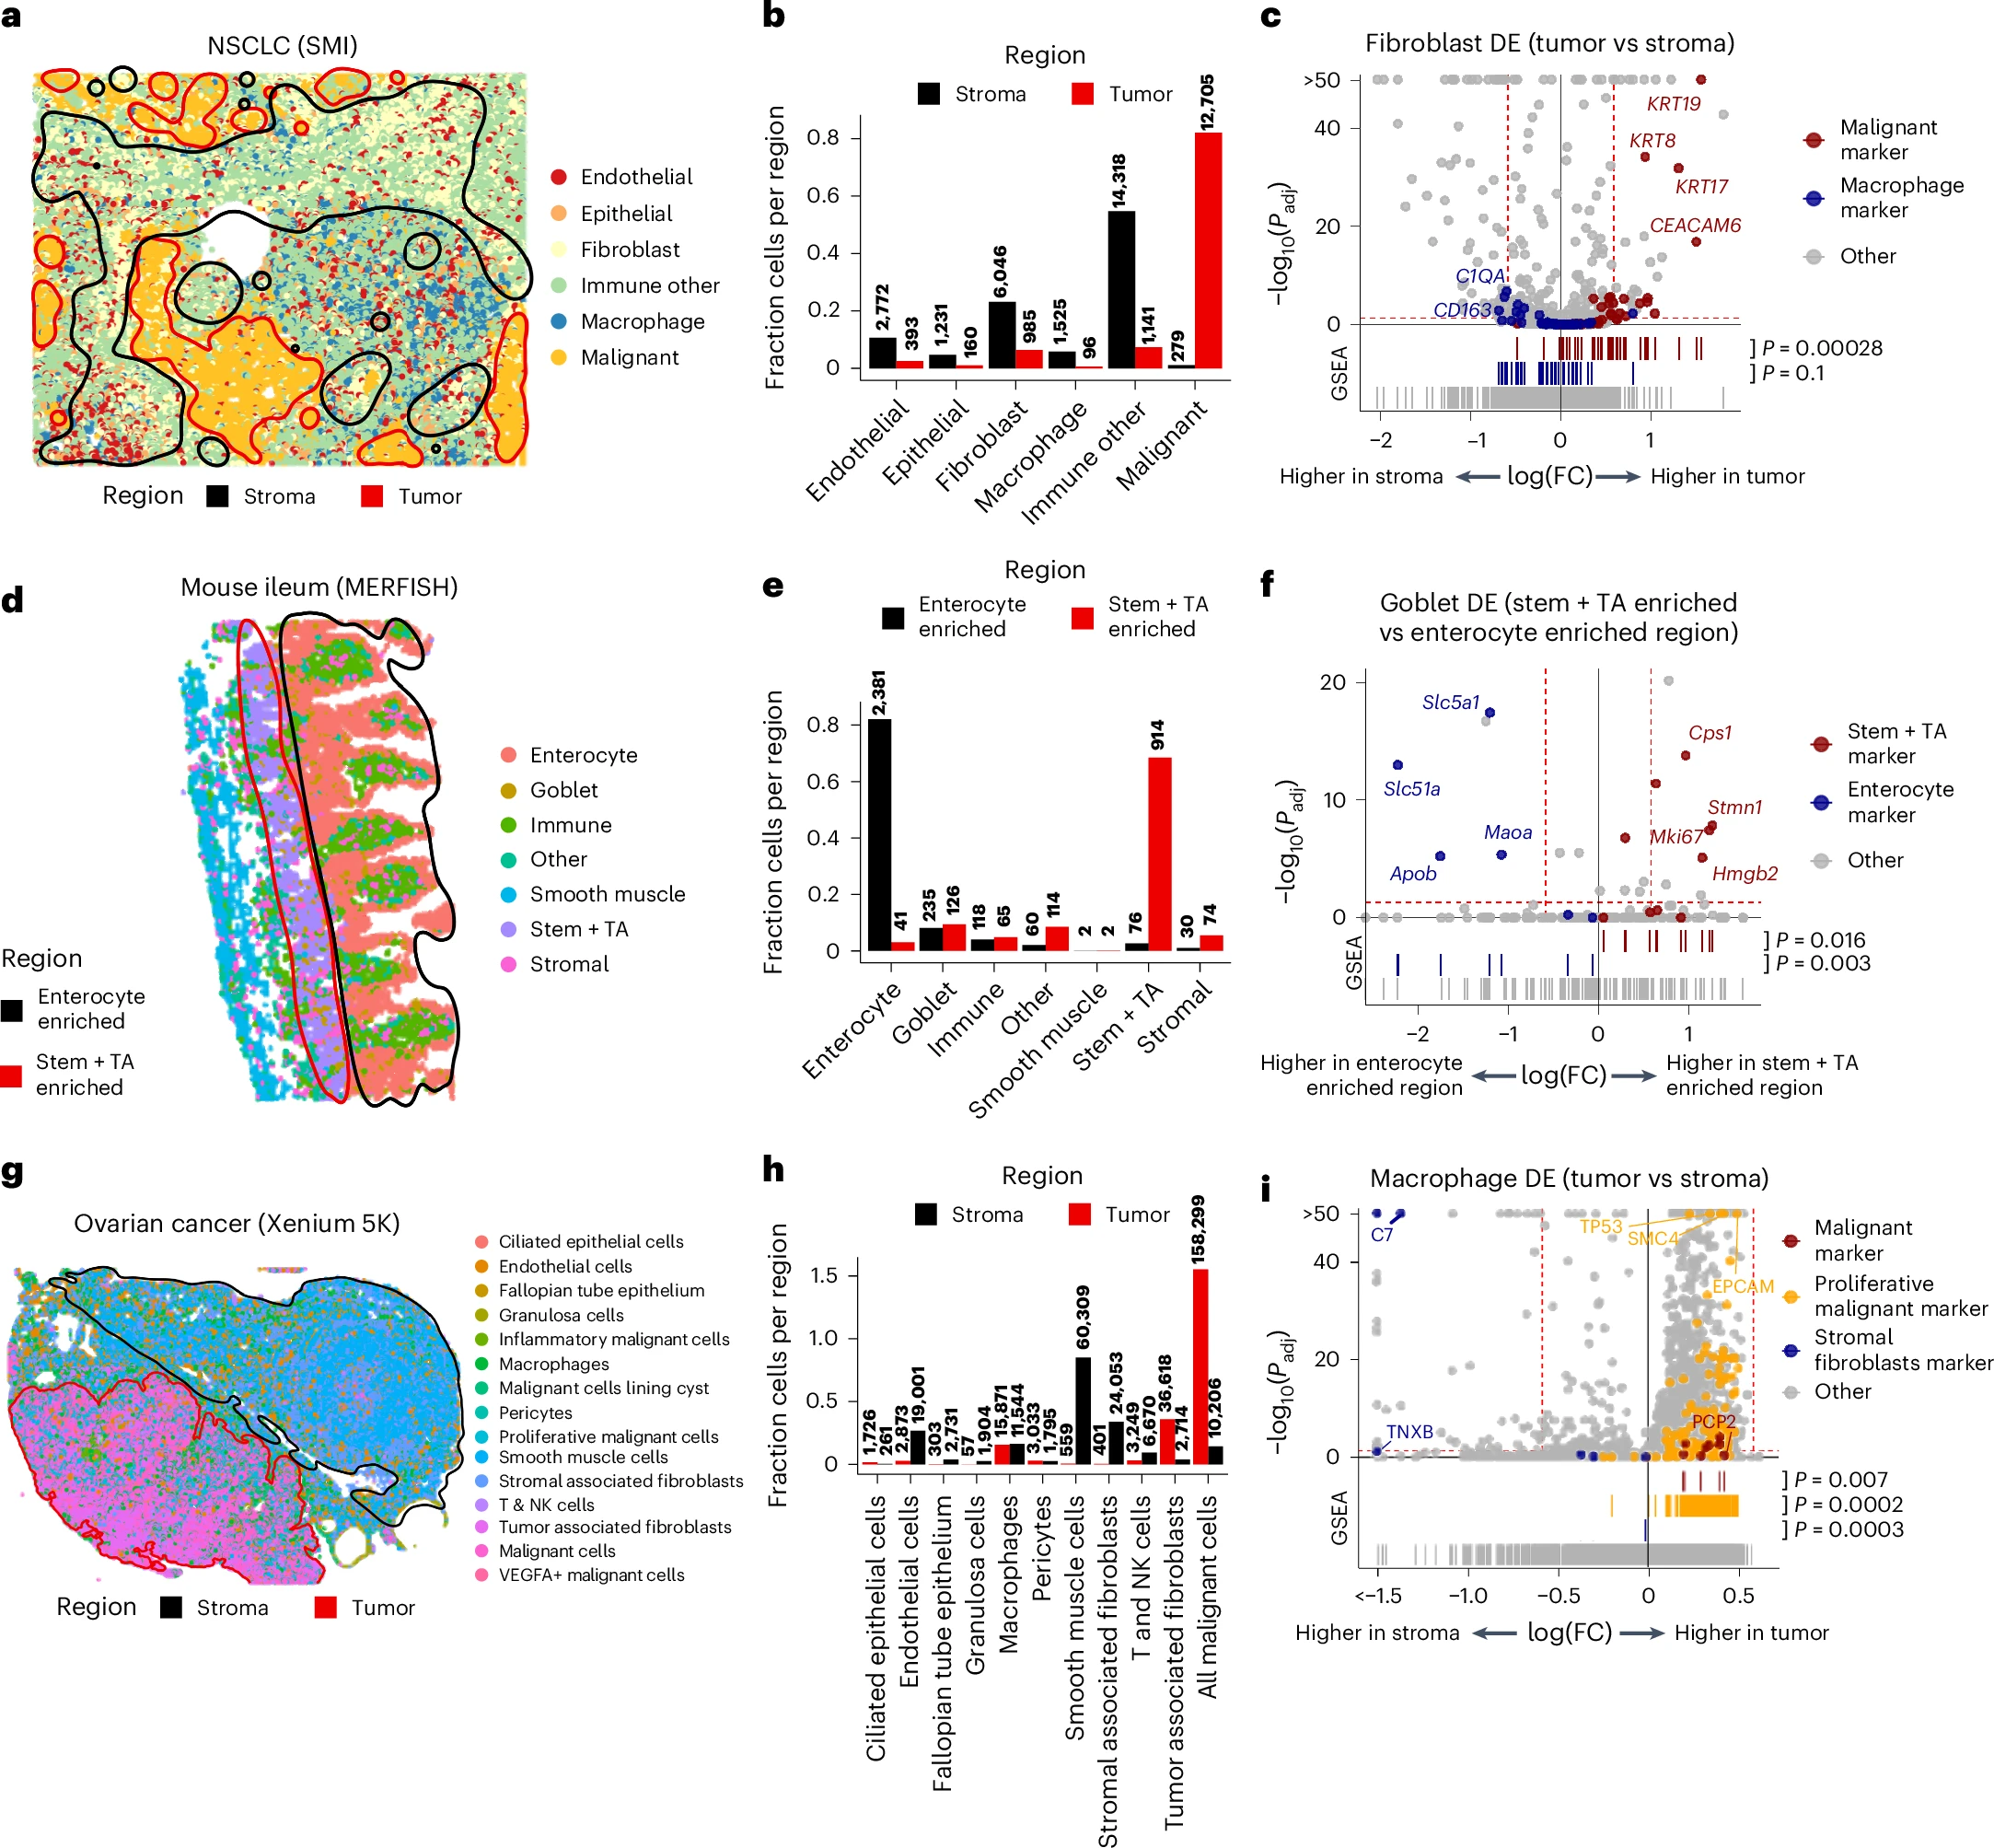
a, CosMx data from one NSCLC patient. Cell types are shown as different colored points. Circled regions indicate which contexts were used for comparison in DE. The tumor interior region is circled in red and the stroma is circled in black. b, Cell-type composition in the tumor interior and stroma regions. Composition is shown as the fraction of all cells in a region coming from cells of a given cell type. c, Fibroblast DE between tumor and stroma regions. scRNA-seq marker genes of malignant cells and macrophages are shown in red and blue colors, respectively. P values were calculated from a two-sided Wilcoxon rank-sum test and were FDR adjusted. The marker gene enrichment P values were calculated with a GSEA test (two sided). d, As with a, but for the mouse ileum data. The stem + TA enriched crypt region is circled in red, and enterocyte enriched villi region is circled in black. e, As with b, but for the mouse ileum crypt and villi regions. f, As with c, but for goblet cell DE between crypt and villi regions. scRNA-seq marker genes of stem + TA cells and enterocytes are shown in red and blue colors, respectively. P values were calculated the same way as in c. g, As with a, but for the ovarian cancer dataset. The tumor region is circled in red and the stroma is circled in black. h, As with b, but for the ovarian cancer dataset tumor and stroma regions. i, As with c, but for macrophage DE between the tumor and stroma regions. scRNA-seq marker genes of malignant cells, proliferative malignant cells and fibroblasts are shown as red, orange and blue colors, respectively. P values were calculated the same way as in c. FDR, false discovery rate; SMI, CosMx Spatial Molecular Imager.
Their reanalysis revealed that segmentation mistakes are far more common and impactful than many researchers realize. When RNA molecules are incorrectly assigned to neighboring cells, it can distort nearly every downstream analysis. Measurements of gene expression differences between cells, assessments of how neighboring cells influence each other, and predictions of ligand receptor interactions can all be dominated by these errors rather than true biology.
To address this problem, the authors introduced a computational strategy based on matrix factorization of local molecular neighborhoods. Instead of relying solely on predefined cell borders, this approach detects mixed molecular signals that arise when RNA from different cells is mistakenly combined. By identifying and separating these admixtures, the method reduces their influence on downstream analyses. The concept is similar to doublet filtering used in single cell RNA sequencing, where signals from two cells captured together are detected and corrected.
As spatial transcriptomics becomes more widely used, this work highlights the importance of carefully accounting for segmentation errors. Improving how RNA molecules are assigned to cells will be critical for accurately interpreting tissue organization, cell communication, and molecular mechanisms underlying health and disease.
Availability – The tool for removing admixture can be found on the GitHub repository at https://github.com/kharchenkolab/cellAdmix and on Zenodo at https://doi.org/10.5281/zenodo.17957138.
Mitchel J, Gao T, Petukhov V, Cole E, Kharchenko PV. (2026) Impact and correction of segmentation errors in spatial transcriptomics. Nature Genetics [Epub ahead of print]. [article]
Related Posts




Spatial transcriptomics is a powerful approach for studying how cells behave within intact tissues. By measuring where RNA molecules are located inside a tissue, scientists can connect gene activity to specific cell types and their surrounding environment. Imaging-based spatial methods are especially attractive because they can capture molecular information at very high resolution, sometimes down to individual molecules inside cells.
A major challenge, however, lies in correctly defining the boundaries of each cell. This step, called cell segmentation, determines which RNA molecules belong to which cell. A team led by researchers at Harvard Medical School examined spatial transcriptomics datasets from multiple tissues and experimental platforms to understand how segmentation errors affect results.
Segmentation errors confound context-dependent DE results
a, CosMx data from one NSCLC patient. Cell types are shown as different colored points. Circled regions indicate which contexts were used for comparison in DE. The tumor interior region is circled in red and the stroma is circled in black. b, Cell-type composition in the tumor interior and stroma regions. Composition is shown as the fraction of all cells in a region coming from cells of a given cell type. c, Fibroblast DE between tumor and stroma regions. scRNA-seq marker genes of malignant cells and macrophages are shown in red and blue colors, respectively. P values were calculated from a two-sided Wilcoxon rank-sum test and were FDR adjusted. The marker gene enrichment P values were calculated with a GSEA test (two sided). d, As with a, but for the mouse ileum data. The stem + TA enriched crypt region is circled in red, and enterocyte enriched villi region is circled in black. e, As with b, but for the mouse ileum crypt and villi regions. f, As with c, but for goblet cell DE between crypt and villi regions. scRNA-seq marker genes of stem + TA cells and enterocytes are shown in red and blue colors, respectively. P values were calculated the same way as in c. g, As with a, but for the ovarian cancer dataset. The tumor region is circled in red and the stroma is circled in black. h, As with b, but for the ovarian cancer dataset tumor and stroma regions. i, As with c, but for macrophage DE between the tumor and stroma regions. scRNA-seq marker genes of malignant cells, proliferative malignant cells and fibroblasts are shown as red, orange and blue colors, respectively. P values were calculated the same way as in c. FDR, false discovery rate; SMI, CosMx Spatial Molecular Imager.
Their reanalysis revealed that segmentation mistakes are far more common and impactful than many researchers realize. When RNA molecules are incorrectly assigned to neighboring cells, it can distort nearly every downstream analysis. Measurements of gene expression differences between cells, assessments of how neighboring cells influence each other, and predictions of ligand receptor interactions can all be dominated by these errors rather than true biology.
To address this problem, the authors introduced a computational strategy based on matrix factorization of local molecular neighborhoods. Instead of relying solely on predefined cell borders, this approach detects mixed molecular signals that arise when RNA from different cells is mistakenly combined. By identifying and separating these admixtures, the method reduces their influence on downstream analyses. The concept is similar to doublet filtering used in single cell RNA sequencing, where signals from two cells captured together are detected and corrected.
As spatial transcriptomics becomes more widely used, this work highlights the importance of carefully accounting for segmentation errors. Improving how RNA molecules are assigned to cells will be critical for accurately interpreting tissue organization, cell communication, and molecular mechanisms underlying health and disease.
Availability – The tool for removing admixture can be found on the GitHub repository at https://github.com/kharchenkolab/cellAdmix and on Zenodo at https://doi.org/10.5281/zenodo.17957138.
Mitchel J, Gao T, Petukhov V, Cole E, Kharchenko PV. (2026) Impact and correction of segmentation errors in spatial transcriptomics. Nature Genetics [Epub ahead of print]. [article]
Related Posts
Recent Posts
 Scientists identify the neuroblastoma cells that signal poor outcomes
 GARAGE improves rare cell detection in single-cell RNA sequencing analysis using AI
 Machine learning reveals how RNA splicing is regulated in individual cell types
 Illumina releases SpliceAI2 to help advance rare disease research
 Postdoctoral Fellow – Long-Read RNA Methods Development for Neurodegeneration
 Novel biosensor uses DNA ‘barcodes’ to uncover disease signals in cells
RNA-Seq Products & Services



Stay Connected