

A team led by researchers at the Perelman School of Medicine, University of Pennsylvania, have developed a powerful new tool called Longcell to improve the analysis of alternative splicing using Nanopore RNA sequencing. Alternative splicing is a biological process that allows a single gene to produce multiple RNA variants or “isoforms,” which can have different functions in the cell. Understanding how these isoforms vary between individual cells or across different regions of tissue is important for learning how genes are regulated in health and disease.
Long-read RNA sequencing, such as that offered by Nanopore technology, is especially useful because it reads entire RNA molecules from start to finish. This allows scientists to see the full sequence of each isoform, rather than piecing together short fragments. However, long-read sequencing comes with challenges. Nanopore reads tend to have higher error rates compared to short-read methods, making it difficult to correctly identify cell barcodes and unique molecular identifiers (UMIs). These barcodes are essential to link RNA reads to their original cells, especially in single-cell and spatial transcriptomics experiments. Additionally, issues like read truncation and misalignment can make it hard to accurately quantify isoforms.
To tackle these problems, the team created Longcell, a computational pipeline designed specifically for Nanopore long reads that are tagged with single-cell or spatial barcodes. Longcell works by cleaning up sequencing errors, reliably recovering cell and spatial barcodes, and modeling the diversity of RNA isoforms both within single cells and across spatial spots on a tissue sample. This level of analysis allows researchers to detect “isoform switching,” where the types of RNA molecules produced change depending on the cell’s location or state.
Overview of single cell Nanopore RNA seq preprocessing in Longcell
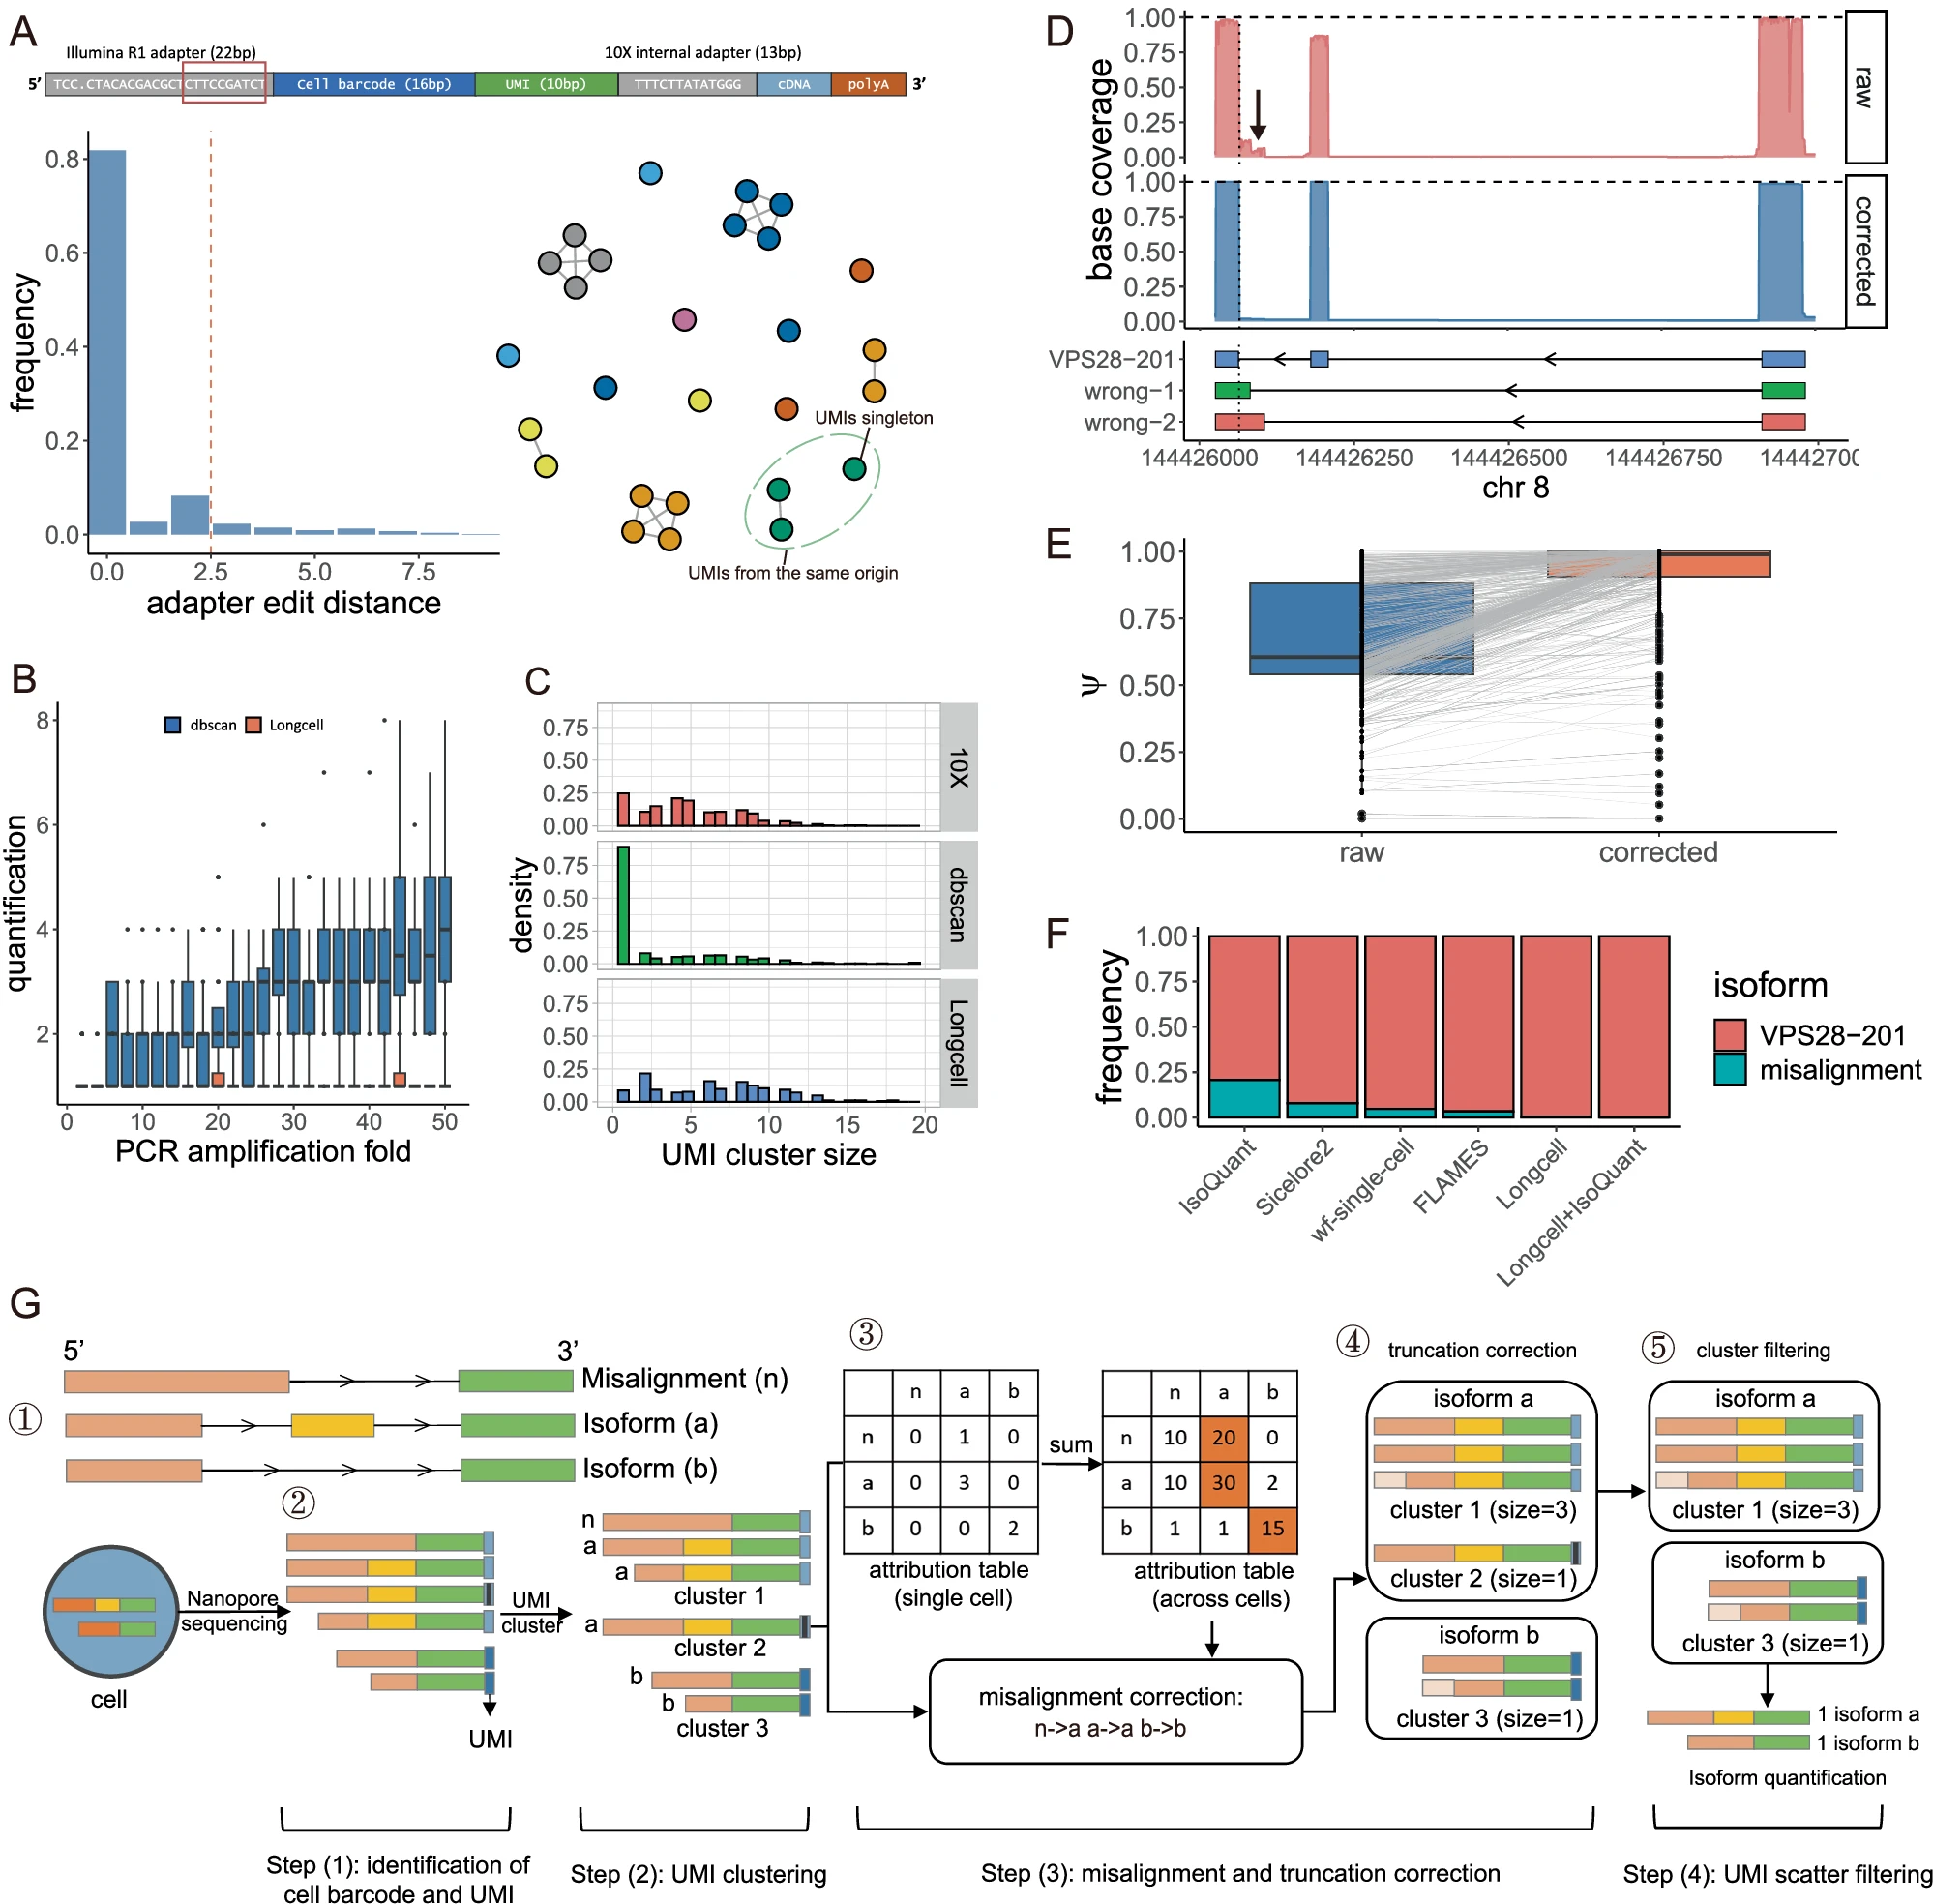
A Top: The structure of a read in 10 × 5’ toolkit. Bottom left: Edit distance distribution between 10mers aside the confidently identified cell barcode and the original sequences. Bottom right: UMI graph constructed using this distribution. UMIs highlighted in green originate from the same molecule but fail to be connected due to sequencing errors. B Application of DBSCAN (blue) and Longcell (coral) to sampled 10-mer adapters across simulated amplification levels (n = 20 replicates per level). C UMI cluster size distribution for gene ENSG00000269590, which has only one isoform. Compared to 10× short reads, DBSCAN applied to Nanopore reads produces more singleton and small clusters. D Correction of wrongly mapped exons for VPS28-201 after UMI deduplication. The misaligned region is indicated by a black arrow. E Bulk-level percent-spliced-in () estimation for constitutive exons before (blue) and after (coral) Longcell correction. Each point represents an exon (n = 1146 from 325 genes); lines connect values for the same exon pre- and post-processing. F Comparison for isoform quantification of VPS28 across methods. The y-axis shows the proportion of misaligned reads mapped to VPS28-201. G Overview of Longcell: ① simulated isoforms for a gene, including two true isoforms (a and b) and a misaligned (n). ② UMIs are first clustered within each cell. In the example cell, three UMI clusters are formed. ③ Misalignment correction is performed using an isoform attribution table built per cell based on UMI clusters. Using cluster 1 as an example, isoform (a) is the majority, so the misaligned read (n) is attributed to isoform a, and (n, a) is recorded as 1 in the table. The table is then aggregated across cells and isoforms which are frequently assigned to other isoforms are classified as misalignment. ④ Truncation errors are corrected by comparing to complete read within each cluster. In the example, the truncated 5’ end for the third read in cluster 1 and the second read in cluster 3 is corrected. ⑤ Small UMI clusters are pruned based on cluster size distributions for each isoform. All boxplots show the median (center line), the 25th and 75th percentiles (bounds of the box), and whiskers extend to 1.5× the interquartile range from the box limits. Outliers beyond 1.5× IQR are shown as individual points.
When applied to multiple real datasets, Longcell revealed extensive isoform variation even within highly expressed genes in individual cells. It also helped identify changes in splicing after experimentally altering nine different splicing factors, with these regulatory targets confirmed through further targeted sequencing experiments.
This advancement bridges a critical gap, allowing scientists to explore gene regulation and RNA diversity with unprecedented accuracy at single-cell and spatial resolution, even when using error-prone long-read sequencing technology. Ultimately, tools like Longcell could improve our understanding of complex diseases, such as cancer or neurological disorders, where alternative splicing plays a key role.
Availability – The scripts for the preprocessing of single-cell long reads are wrapped and collected in two R packages: Longcellsrc and LongcellPre. Longcellsrc is available at https://github.com/yuntianf/Longcellsrc
Fu Y, Kim H, Roy S, Huang S, Adams J, Grimes S, Lau B, Sathe A, Ji H, Zhang N. (2025) Single cell and spatial alternative splicing analysis with Nanopore long read sequencing. Nature Communications 16(1): 6654. [article]
Related Posts




A team led by researchers at the Perelman School of Medicine, University of Pennsylvania, have developed a powerful new tool called Longcell to improve the analysis of alternative splicing using Nanopore RNA sequencing. Alternative splicing is a biological process that allows a single gene to produce multiple RNA variants or “isoforms,” which can have different functions in the cell. Understanding how these isoforms vary between individual cells or across different regions of tissue is important for learning how genes are regulated in health and disease.
Long-read RNA sequencing, such as that offered by Nanopore technology, is especially useful because it reads entire RNA molecules from start to finish. This allows scientists to see the full sequence of each isoform, rather than piecing together short fragments. However, long-read sequencing comes with challenges. Nanopore reads tend to have higher error rates compared to short-read methods, making it difficult to correctly identify cell barcodes and unique molecular identifiers (UMIs). These barcodes are essential to link RNA reads to their original cells, especially in single-cell and spatial transcriptomics experiments. Additionally, issues like read truncation and misalignment can make it hard to accurately quantify isoforms.
To tackle these problems, the team created Longcell, a computational pipeline designed specifically for Nanopore long reads that are tagged with single-cell or spatial barcodes. Longcell works by cleaning up sequencing errors, reliably recovering cell and spatial barcodes, and modeling the diversity of RNA isoforms both within single cells and across spatial spots on a tissue sample. This level of analysis allows researchers to detect “isoform switching,” where the types of RNA molecules produced change depending on the cell’s location or state.
Overview of single cell Nanopore RNA seq preprocessing in Longcell
A Top: The structure of a read in 10 × 5’ toolkit. Bottom left: Edit distance distribution between 10mers aside the confidently identified cell barcode and the original sequences. Bottom right: UMI graph constructed using this distribution. UMIs highlighted in green originate from the same molecule but fail to be connected due to sequencing errors. B Application of DBSCAN (blue) and Longcell (coral) to sampled 10-mer adapters across simulated amplification levels (n = 20 replicates per level). C UMI cluster size distribution for gene ENSG00000269590, which has only one isoform. Compared to 10× short reads, DBSCAN applied to Nanopore reads produces more singleton and small clusters. D Correction of wrongly mapped exons for VPS28-201 after UMI deduplication. The misaligned region is indicated by a black arrow. E Bulk-level percent-spliced-in () estimation for constitutive exons before (blue) and after (coral) Longcell correction. Each point represents an exon (n = 1146 from 325 genes); lines connect values for the same exon pre- and post-processing. F Comparison for isoform quantification of VPS28 across methods. The y-axis shows the proportion of misaligned reads mapped to VPS28-201. G Overview of Longcell: ① simulated isoforms for a gene, including two true isoforms (a and b) and a misaligned (n). ② UMIs are first clustered within each cell. In the example cell, three UMI clusters are formed. ③ Misalignment correction is performed using an isoform attribution table built per cell based on UMI clusters. Using cluster 1 as an example, isoform (a) is the majority, so the misaligned read (n) is attributed to isoform a, and (n, a) is recorded as 1 in the table. The table is then aggregated across cells and isoforms which are frequently assigned to other isoforms are classified as misalignment. ④ Truncation errors are corrected by comparing to complete read within each cluster. In the example, the truncated 5’ end for the third read in cluster 1 and the second read in cluster 3 is corrected. ⑤ Small UMI clusters are pruned based on cluster size distributions for each isoform. All boxplots show the median (center line), the 25th and 75th percentiles (bounds of the box), and whiskers extend to 1.5× the interquartile range from the box limits. Outliers beyond 1.5× IQR are shown as individual points.
When applied to multiple real datasets, Longcell revealed extensive isoform variation even within highly expressed genes in individual cells. It also helped identify changes in splicing after experimentally altering nine different splicing factors, with these regulatory targets confirmed through further targeted sequencing experiments.
This advancement bridges a critical gap, allowing scientists to explore gene regulation and RNA diversity with unprecedented accuracy at single-cell and spatial resolution, even when using error-prone long-read sequencing technology. Ultimately, tools like Longcell could improve our understanding of complex diseases, such as cancer or neurological disorders, where alternative splicing plays a key role.
Availability – The scripts for the preprocessing of single-cell long reads are wrapped and collected in two R packages: Longcellsrc and LongcellPre. Longcellsrc is available at https://github.com/yuntianf/Longcellsrc
Fu Y, Kim H, Roy S, Huang S, Adams J, Grimes S, Lau B, Sathe A, Ji H, Zhang N. (2025) Single cell and spatial alternative splicing analysis with Nanopore long read sequencing. Nature Communications 16(1): 6654. [article]
Related Posts
Recent Posts
 Scientists identify the neuroblastoma cells that signal poor outcomes
 GARAGE improves rare cell detection in single-cell RNA sequencing analysis using AI
 Machine learning reveals how RNA splicing is regulated in individual cell types
 Illumina releases SpliceAI2 to help advance rare disease research
 Postdoctoral Fellow – Long-Read RNA Methods Development for Neurodegeneration
 Novel biosensor uses DNA ‘barcodes’ to uncover disease signals in cells
RNA-Seq Products & Services


Stay Connected