


RNA molecules carry more information than just the genetic instructions used to make proteins. They also contain chemical modifications that can influence how genes are regulated. One of the most common and important of these modifications is N6-methyladenosine, commonly known as m6A. Although scientists have learned a great deal about m6A in recent years, understanding exactly where these modifications occur within tissues has remained a significant challenge.
Researchers from the University of Chicago have developed a new technology called m6A-ARTR-DBiT that allows scientists to visualize the spatial distribution of m6A modifications across entire tissue sections while preserving the natural organization of the tissue.
The technique combines reverse-transcription-based detection with spatial barcoding methods to create detailed maps of m6A modifications alongside gene expression information. This enables researchers to examine both where genes are active and where RNA modifications are occurring within the same biological context.
m6A-ARTR-DBiT workflow and specificity validation
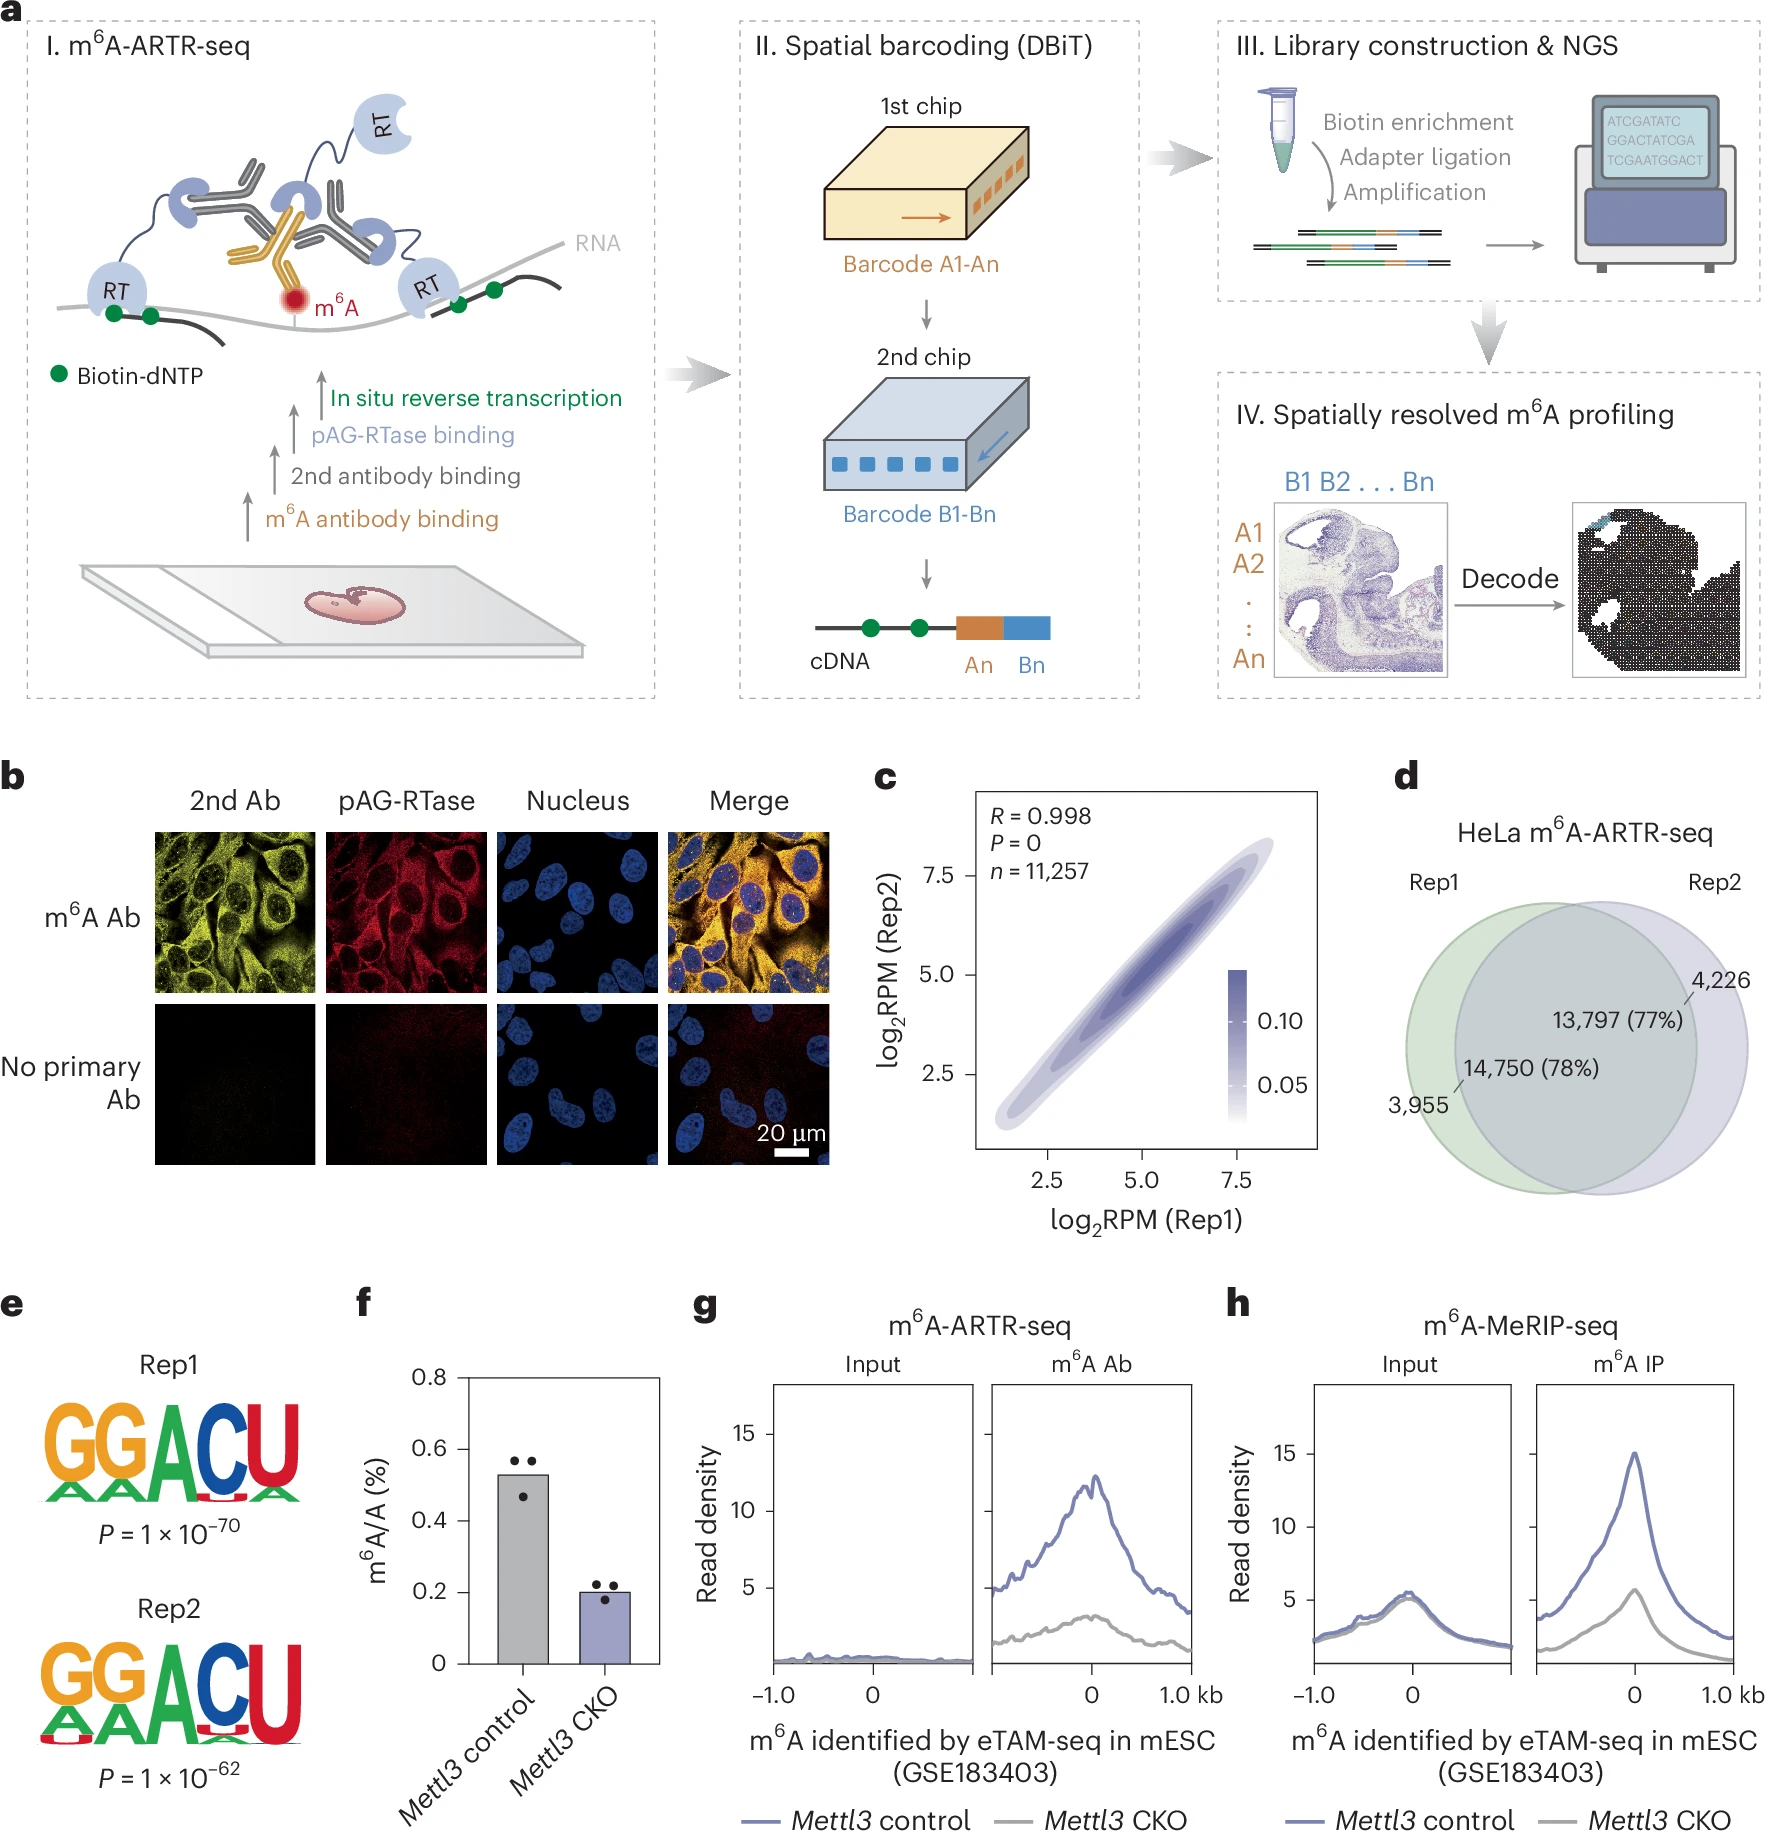
a, Schematic illustrating m6A-ARTR-DBiT workflow for spatially resolved m6A profiling. All icons were created by the authors using Adobe Illustrator and ChemDraw. b, Immunofluorescence imaging showing secondary antibody (2nd Ab, yellow), pAG-RTase (red) and nucleus (blue). c, Heatmap displaying replicate correlations of m6A-ARTR-seq reads per gene, normalized to coverage (RPM) in HeLa cells. Coefficient R and P values were calculated using a two-tailed Pearson’s correlation. d, Venn diagrams illustrating peak overlaps between two m6A-ARTR-seq replicates. e, Motifs of m6A peaks identified by m6A-ARTR-seq. P values were calculated using a two-tailed binomial test in the HOMER suite. f, Liquid chromatography–tandem mass spectrometry measurement of the m6A/A ratio in poly(A) RNA extracted from Mettl3 control and Mettl3 CKO. n = 3 technical replicates. g,h, Signal profiles of read density at m6A sites identified by eTAM-seq for m6A-ARTR-seq (g) and m6A-MeRIP-seq (h). NGS, next-generation sequencing; Rep, replicate; RT, reverse transcriptase; IP, immunoprecipitation.
To demonstrate the power of the method, the research team applied m6A-ARTR-DBiT to mouse embryonic tissues and adult mouse brains. The resulting maps revealed that m6A modifications are not distributed uniformly throughout tissues. Instead, distinct regions showed unique m6A patterns that were associated with specific biological functions and tissue structures.
By comparing spatial m6A maps with spatial transcriptomic data, the researchers found positive correlations between m6A levels and the expression of proteins involved in adding and recognizing these modifications. In particular, higher levels of m6A often corresponded with increased expression of methyltransferases, the enzymes that install m6A marks, as well as m6A-binding proteins that help interpret these signals.
These findings suggest that tissue-specific patterns of RNA modification are closely linked to local gene regulation programs. Different regions within the same organ may use m6A in distinct ways to control cellular function and maintain specialized biological roles.
One of the most impressive demonstrations of the technology came from analysis of the mouse hippocampus, a brain region essential for learning and memory. The researchers were able to generate high-resolution maps showing how m6A modifications are organized within fine-scale hippocampal structures. Such detailed information could help scientists better understand how RNA regulation contributes to brain function and neurological disease.
The ability to visualize RNA modifications directly within intact tissues opens new opportunities for studying development, aging, and disease. Traditional RNA analysis methods often require tissues to be broken apart, which removes important spatial information. By preserving tissue architecture, m6A-ARTR-DBiT allows researchers to investigate how RNA modifications vary between neighboring cell populations and functional regions.
As spatial biology technologies continue to advance, tools such as m6A-ARTR-DBiT will help researchers build a more complete picture of gene regulation. Understanding where RNA modifications occur, and how they influence cellular behavior in specific tissue environments, may ultimately provide new insights into development, neuroscience, cancer biology, and many other fields of biomedical research.
Availability – The code used for processing m6A-ARTR-DBiT data is available at the following GitHub repository: https://github.com/YXx-x23/m6A-ARTR-DBiT
Xiao Y, Bai Z, Zou Z, Ye C, Tao B, Zheng Z, Chen YM, Zou Z, Jiang L, Zhao L, Fan Y, Gao Y, Fan R, He C. (2026) Spatially resolved m6A profiling using m6A-ARTR-DBiT. Nature Methods [Epub ahead of print]. [article]
Related Posts




RNA molecules carry more information than just the genetic instructions used to make proteins. They also contain chemical modifications that can influence how genes are regulated. One of the most common and important of these modifications is N6-methyladenosine, commonly known as m6A. Although scientists have learned a great deal about m6A in recent years, understanding exactly where these modifications occur within tissues has remained a significant challenge.
Researchers from the University of Chicago have developed a new technology called m6A-ARTR-DBiT that allows scientists to visualize the spatial distribution of m6A modifications across entire tissue sections while preserving the natural organization of the tissue.
The technique combines reverse-transcription-based detection with spatial barcoding methods to create detailed maps of m6A modifications alongside gene expression information. This enables researchers to examine both where genes are active and where RNA modifications are occurring within the same biological context.
m6A-ARTR-DBiT workflow and specificity validation
a, Schematic illustrating m6A-ARTR-DBiT workflow for spatially resolved m6A profiling. All icons were created by the authors using Adobe Illustrator and ChemDraw. b, Immunofluorescence imaging showing secondary antibody (2nd Ab, yellow), pAG-RTase (red) and nucleus (blue). c, Heatmap displaying replicate correlations of m6A-ARTR-seq reads per gene, normalized to coverage (RPM) in HeLa cells. Coefficient R and P values were calculated using a two-tailed Pearson’s correlation. d, Venn diagrams illustrating peak overlaps between two m6A-ARTR-seq replicates. e, Motifs of m6A peaks identified by m6A-ARTR-seq. P values were calculated using a two-tailed binomial test in the HOMER suite. f, Liquid chromatography–tandem mass spectrometry measurement of the m6A/A ratio in poly(A) RNA extracted from Mettl3 control and Mettl3 CKO. n = 3 technical replicates. g,h, Signal profiles of read density at m6A sites identified by eTAM-seq for m6A-ARTR-seq (g) and m6A-MeRIP-seq (h). NGS, next-generation sequencing; Rep, replicate; RT, reverse transcriptase; IP, immunoprecipitation.
To demonstrate the power of the method, the research team applied m6A-ARTR-DBiT to mouse embryonic tissues and adult mouse brains. The resulting maps revealed that m6A modifications are not distributed uniformly throughout tissues. Instead, distinct regions showed unique m6A patterns that were associated with specific biological functions and tissue structures.
By comparing spatial m6A maps with spatial transcriptomic data, the researchers found positive correlations between m6A levels and the expression of proteins involved in adding and recognizing these modifications. In particular, higher levels of m6A often corresponded with increased expression of methyltransferases, the enzymes that install m6A marks, as well as m6A-binding proteins that help interpret these signals.
These findings suggest that tissue-specific patterns of RNA modification are closely linked to local gene regulation programs. Different regions within the same organ may use m6A in distinct ways to control cellular function and maintain specialized biological roles.
One of the most impressive demonstrations of the technology came from analysis of the mouse hippocampus, a brain region essential for learning and memory. The researchers were able to generate high-resolution maps showing how m6A modifications are organized within fine-scale hippocampal structures. Such detailed information could help scientists better understand how RNA regulation contributes to brain function and neurological disease.
The ability to visualize RNA modifications directly within intact tissues opens new opportunities for studying development, aging, and disease. Traditional RNA analysis methods often require tissues to be broken apart, which removes important spatial information. By preserving tissue architecture, m6A-ARTR-DBiT allows researchers to investigate how RNA modifications vary between neighboring cell populations and functional regions.
As spatial biology technologies continue to advance, tools such as m6A-ARTR-DBiT will help researchers build a more complete picture of gene regulation. Understanding where RNA modifications occur, and how they influence cellular behavior in specific tissue environments, may ultimately provide new insights into development, neuroscience, cancer biology, and many other fields of biomedical research.
Availability – The code used for processing m6A-ARTR-DBiT data is available at the following GitHub repository: https://github.com/YXx-x23/m6A-ARTR-DBiT
Xiao Y, Bai Z, Zou Z, Ye C, Tao B, Zheng Z, Chen YM, Zou Z, Jiang L, Zhao L, Fan Y, Gao Y, Fan R, He C. (2026) Spatially resolved m6A profiling using m6A-ARTR-DBiT. Nature Methods [Epub ahead of print]. [article]
Related Posts
Recent Posts
 RNAmel simplifies RNA sequencing data analysis with a reproducible, integrated platform
 Heart failure reshapes bone marrow to create inflammation-related immune memory
 Overlooked DNA regions surrounding ‘microexons’ hold missing pieces of autism’s genetic puzzle
 RiboBA improves detection of hidden protein-coding regions using ribosome profiling
 An anti-senescence gene may fight spinal disc deterioration
 Bulk RNA-seq Analysis: A Complete Beginner’s Guide
RNA-Seq Products & Services


Stay Connected