

UC San Diego and Scripps Research scientists used a novel method to show that some memory neurons produce proteins at higher rates than others.

A new method lets researchers visualize messenger RNA translation across different brain cell types. In this image, CA3 pyramidal neurons of the mouse hippocampus glow magenta, indicating especially high rates of protein production. Credit: Scripps Research
The brain’s ability to do everything from forming memories to coordinating movement relies on its cells producing the right proteins at the right time. But directly measuring this protein production, known as translation, across different types of brain cells has been a challenge.
Now, scientists at University of California School of Medicine, Scripps Research and their colleagues have developed a technology that reveals which proteins are generated by individual brain cells. The team used their method — called Ribo-STAMP — to create the first maps of protein production across nearly 20,000 individual cells in the mouse hippocampus, a brain region essential for learning and memory. The study was published on February 18, 2026 in Nature.
“We think this technology will let the field revisit whether neurological conditions, including autism spectrum disorder, fragile X syndrome and tuberous sclerosis complex are caused by defects in translation,” says co-corresponding author Gene Yeo, PhD, professor of cellular and molecular medicine at UC San Diego School of Medicine and founding director of the Center for RNA Technologies and Therapeutics.
In all cells, DNA is first transcribed into messenger RNA (mRNA), a temporary copy of DNA that can travel to the protein-making machinery inside cells. There, the code is translated into proteins, the molecules that perform most cellular functions. Scientists frequently measure mRNA levels as a proxy for which proteins are being made in a cell. But in brain cells, there’s a large disconnect between mRNA levels and proteins. Rather than being quickly turned into proteins, mRNA is often stored in the long spindly arms of neurons, produced in advance and ready when needed.
“It’s been difficult to measure mRNA translation in single cells, despite the field of single cell transcriptomics expanding across tissues, conditions and diseases,” says Yeo, who is also director of the UC San Diego Sanford Stem Cell Institute Innovation Center. “We developed this technology in hopes that it will lead to a more complete picture.”
Yeo’s team had previously developed Ribo-STAMP to directly measure protein production in cells. The method works by fusing a molecular editing enzyme to ribosomes — the molecular machines that carry out translation. As ribosomes translate each mRNA molecule into protein, the enzyme makes nucleotide changes to the RNA strand. Scientists can then use standard RNA sequencing to identify which RNAs were changed.
In the current study, the researchers applied Ribo-STAMP to the brain for the first time. The team focused on the hippocampus, in part because it’s already well-studied and the results could be verified.
“This gave us an entirely different angle to look at the hippocampus, and we found a lot of new and exciting things,” said co-corresponding author Giordano Lippi, associate professor of neuroscience at Scripps Research. “This sort of foundational work is needed to eventually understand what goes wrong at the onset of brain diseases.”
Ribo-STAMP detects BDNF-induced translational dynamics
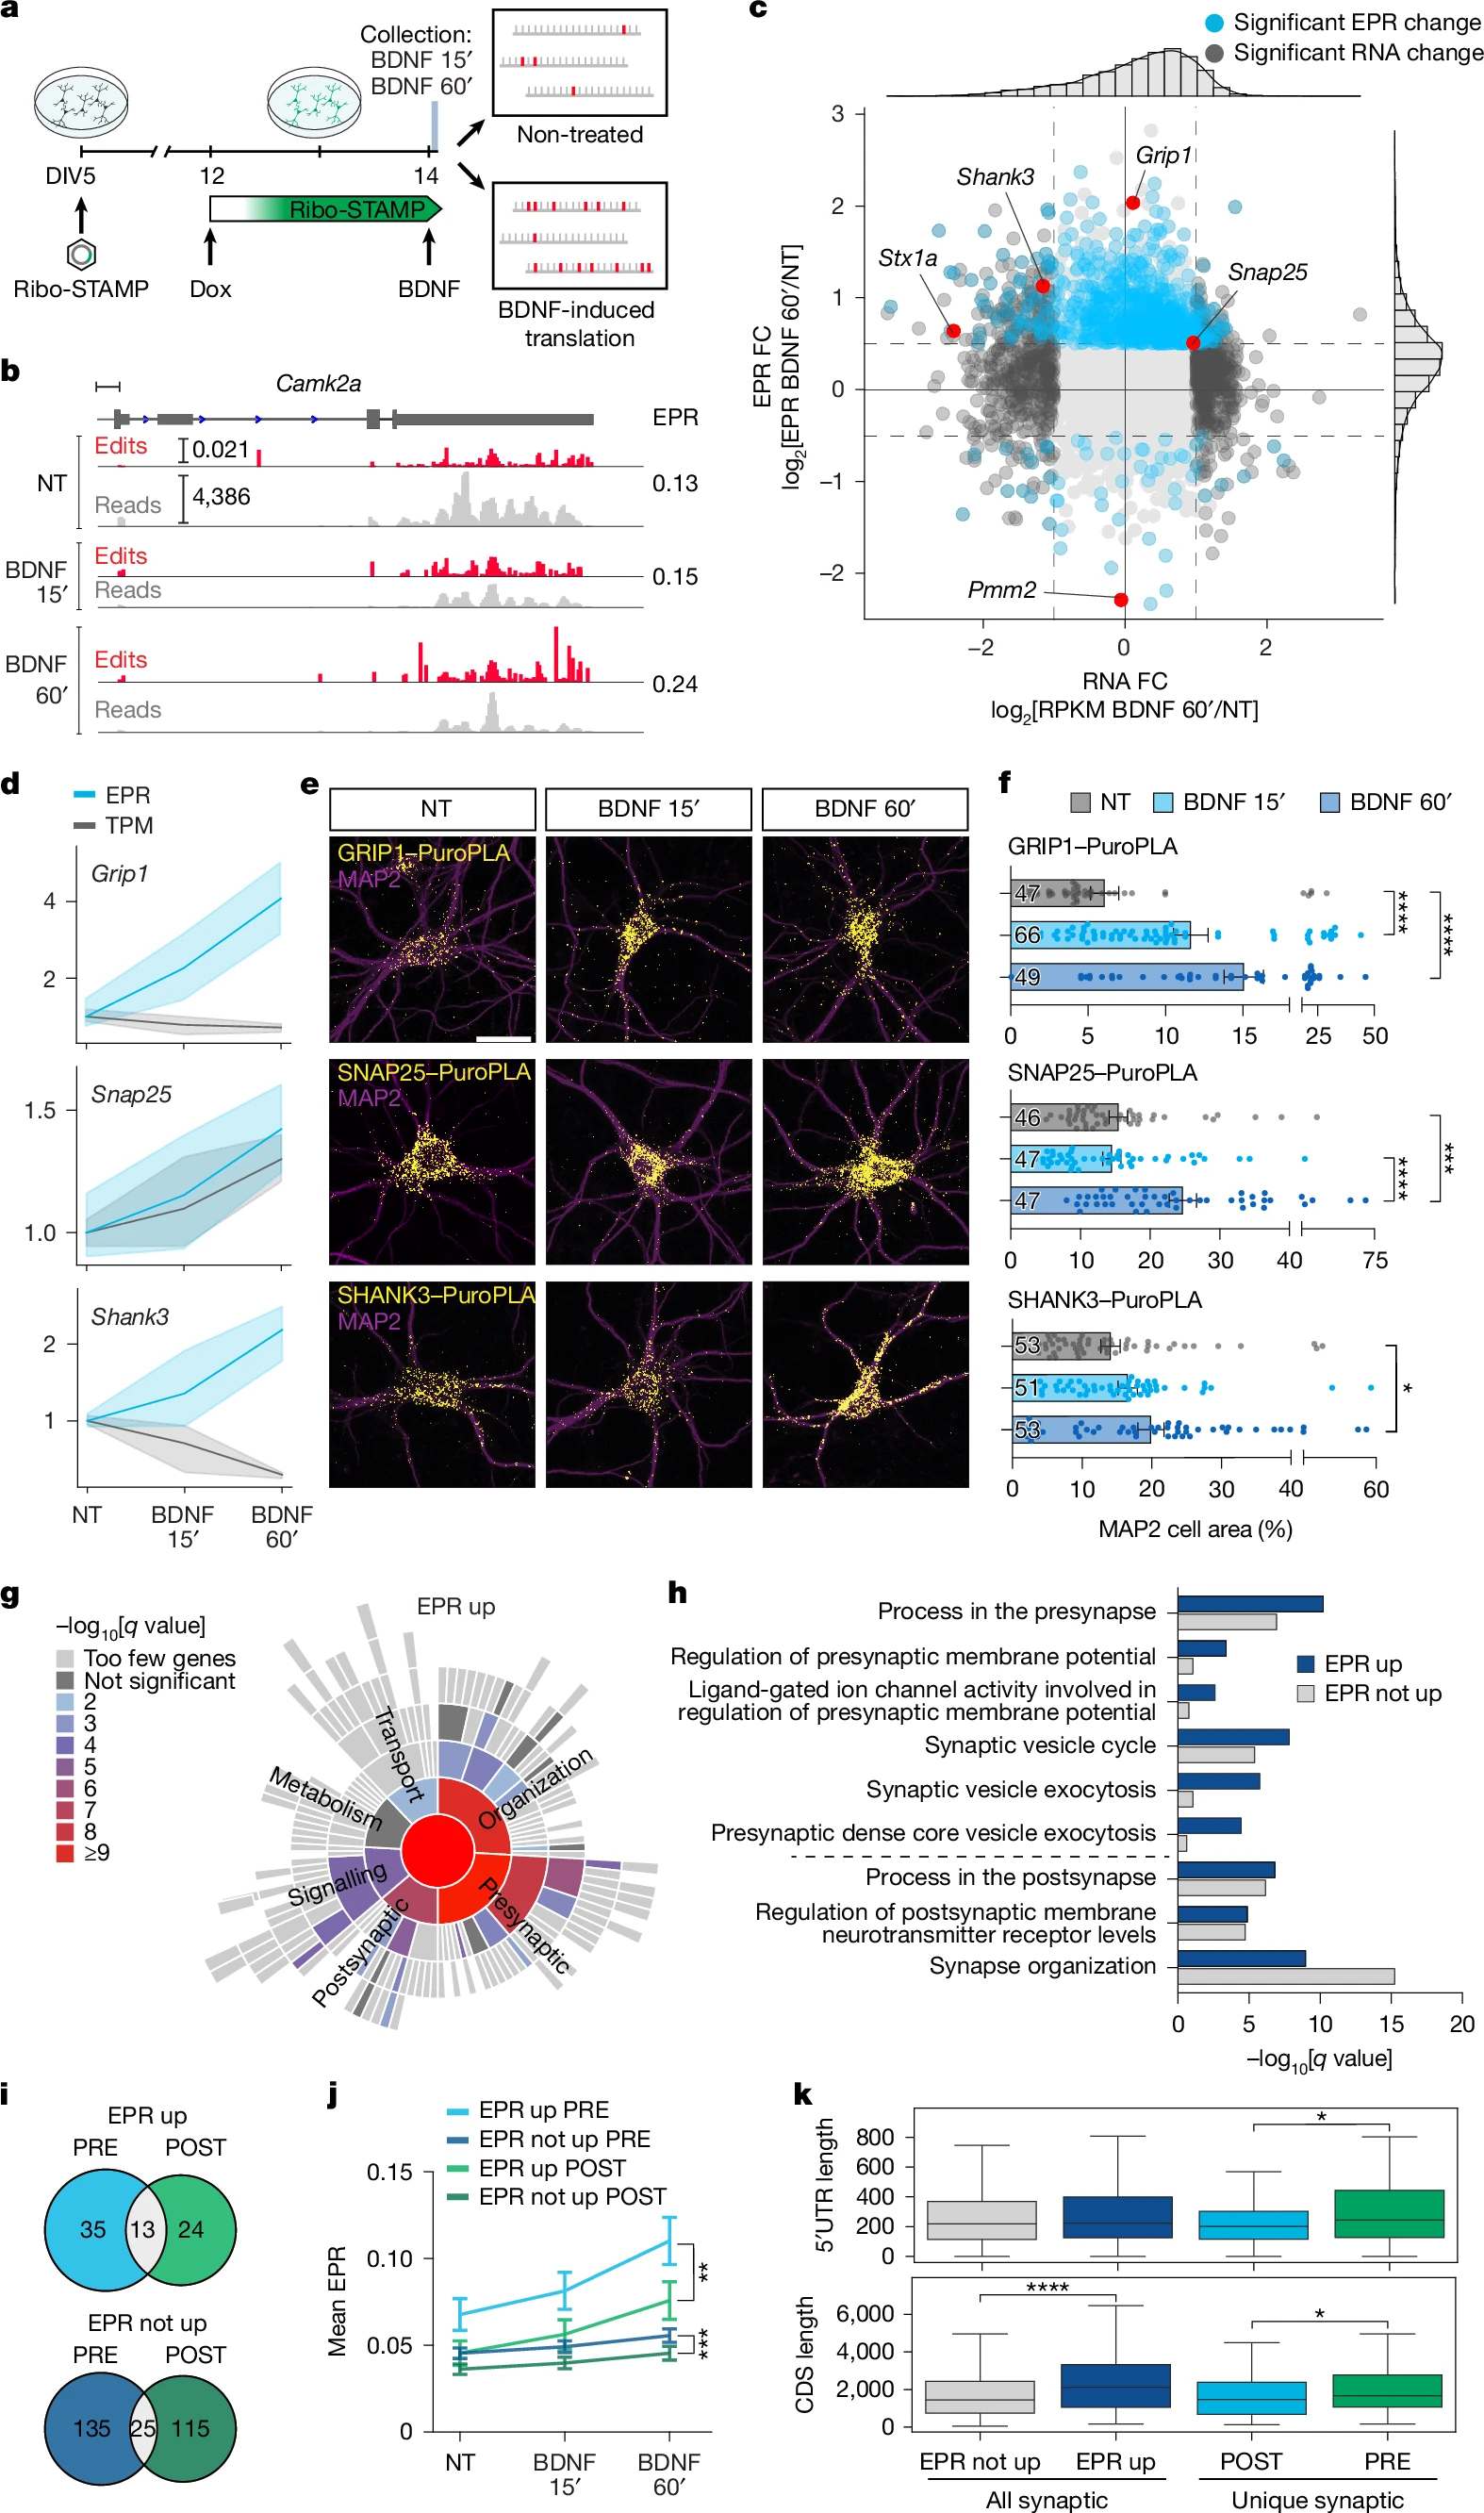
a, Experimental paradigm. b, IGV browser tracks showing counts and edit peaks for Camk2a in non-treated and BDNF-treated primary neurons, with mean EPR levels (right). Edit peaks shown as percentage of edited Cs. c, EPR and RNA differential expression analysis comparing 60′ BDNF-induced and no treatment. Significant EPR change: two-sided t-test; P < 0.05; log2FC > 0.5 or < −0.5. Significant RNA change: Wald test; Benjamini–Hochberg correction; P < 0.01; log2FC > 1 or < −1. Validation candidates highlighted in red. d, EPR and TPM for candidates normalized to no treatment (NT) = 1. The shaded area is s.e.m. e, Puro-PLA representative images. f, Quantification of Puro-PLA positive area from e as percentage of MAP2 cell area. Cell numbers (in columns) over n = 3 biologically independent experiments. g, SynGO analysis of BDNF ‘EPR up’ (log2FC > 0.5; P < 0.05; two-sided t-test) genes. One-sided Fisher’s exact test and Benjamini–Hochberg correction. h, Comparison of example presynaptic and postsynaptic term enrichment from ‘EPR up’ and ‘EPR not up’ SynGO analyses. i, Number of unique presynaptic and postsynaptic genes found in ‘EPR up’ and ‘EPR not up’, and number of shared genes. j, EPR levels of genes in i. k, Comparison of CDS and 5′ UTR length among the gene lists in h and i combined (‘EPR up’ + ‘EPR not up’). All synaptic ‘EPR not up’ n = 818, all synaptic ‘EPR up’ n = 192, unique postsynaptic n = 139 and unique presynaptic n = 170 genes. Box plots show the interquartile range, with the line inside marking the median. Whiskers extend up to 1.5 times the interquartile range from the lower and upper quartiles. Bars represent mean ± s.e.m. (f,j). Kruskal–Wallis test followed by Tukey’s multiple comparison post hoc test (f); GRIP1, Padjust < 0.0001; SNAP25, no treatment versus BDNF 60′ Padjust = 0.0003; BDNF 15′ versus BDNF 60′ Padjust < 0.0001; SHANK3, Padjust = 0.0369. Two-sided Mann–Whitney U-test (j,k). Top, P = 0.002; bottom, P = 0.0008 (j). Top, P = 0.02414; bottom left, P = 1.322 × 10⁻⁶ (k). *P < 0.05; **P < 0.01; ***P < 0.001; ****P < 0.0001. Scale bars, 500 bp (b), 20 μm (e).
When they measured translation in nearly 20,000 individual cells in the mouse hippocampus, they observed some unexpected patterns beyond what was known.
One of the most surprising findings came from comparing two types of neurons critical for memory: CA1 and CA3 pyramidal cells. Despite their similar roles in memory circuits, CA3 neurons showed much higher rates of protein production than CA1 neurons. The findings not only reveal that the pyramidal cell types are less similar than previously believed, but they also suggest an important role for translation in how circuits in the brain coordinate memory.
This study also indicated how different mRNA molecules made from the same gene, known as isoforms, affect how much of the corresponding protein is produced. The researchers, including co-first authors Samantha Sison and Eric Kofman at UC San Diego School of Medicine, and Federico Zampa at Scripps Research, discovered that in hippocampal neurons, isoforms with longer regulatory regions tended to be translated into proteins at a higher rate. Understanding this link better could shed light on how variations in mRNA transcripts could contribute to disease.
“Previous work has shown how changes in isoform expression strongly correlates with neurological disorders, but the reason behind that hasn’t been well-understood,” says Lippi. “Our work suggests that if cells prefer one isoform over another, they may actually be changing protein levels.”
Beyond differences between cell types, the researchers discovered that individual neurons can exist in “high” and “low” translation states, producing proteins at dramatically different rates. Neurons in the high translation state tended to make proteins involved in communication between neurons and energy production, hinting that translation states might distinguish more active neurons from quieter ones.
Yeo said that their dataset on the brain’s “translatome” — the full set of mRNAs that are translated into proteins — is just the beginning of a new understanding of how healthy brain cells coordinate protein production, and what that means for disease.
Source – UC San Diego
Sison SL, Zampa F, Kofman ER, Choi SY, Jagannatha P, Nguyen GG, Naritomi JT, Shin A, Khorgade A, Jin W, Chen CY, Sievert DM, Mukhopadhyay S, Mizrahi O, Blue SM, Marina RJ, Yang D, Wang CC, Pang Z, Brannan KW, Ye L, Al’Khafaji AM, Yeo GW, Lippi G. (2026) Single-cell and isoform-specific translational profiling of the mouse brain. Nature [Epub ahead of print]. [article]
Related Posts




UC San Diego and Scripps Research scientists used a novel method to show that some memory neurons produce proteins at higher rates than others.
A new method lets researchers visualize messenger RNA translation across different brain cell types. In this image, CA3 pyramidal neurons of the mouse hippocampus glow magenta, indicating especially high rates of protein production. Credit: Scripps Research
The brain’s ability to do everything from forming memories to coordinating movement relies on its cells producing the right proteins at the right time. But directly measuring this protein production, known as translation, across different types of brain cells has been a challenge.
Now, scientists at University of California School of Medicine, Scripps Research and their colleagues have developed a technology that reveals which proteins are generated by individual brain cells. The team used their method — called Ribo-STAMP — to create the first maps of protein production across nearly 20,000 individual cells in the mouse hippocampus, a brain region essential for learning and memory. The study was published on February 18, 2026 in Nature.
“We think this technology will let the field revisit whether neurological conditions, including autism spectrum disorder, fragile X syndrome and tuberous sclerosis complex are caused by defects in translation,” says co-corresponding author Gene Yeo, PhD, professor of cellular and molecular medicine at UC San Diego School of Medicine and founding director of the Center for RNA Technologies and Therapeutics.
In all cells, DNA is first transcribed into messenger RNA (mRNA), a temporary copy of DNA that can travel to the protein-making machinery inside cells. There, the code is translated into proteins, the molecules that perform most cellular functions. Scientists frequently measure mRNA levels as a proxy for which proteins are being made in a cell. But in brain cells, there’s a large disconnect between mRNA levels and proteins. Rather than being quickly turned into proteins, mRNA is often stored in the long spindly arms of neurons, produced in advance and ready when needed.
“It’s been difficult to measure mRNA translation in single cells, despite the field of single cell transcriptomics expanding across tissues, conditions and diseases,” says Yeo, who is also director of the UC San Diego Sanford Stem Cell Institute Innovation Center. “We developed this technology in hopes that it will lead to a more complete picture.”
Yeo’s team had previously developed Ribo-STAMP to directly measure protein production in cells. The method works by fusing a molecular editing enzyme to ribosomes — the molecular machines that carry out translation. As ribosomes translate each mRNA molecule into protein, the enzyme makes nucleotide changes to the RNA strand. Scientists can then use standard RNA sequencing to identify which RNAs were changed.
In the current study, the researchers applied Ribo-STAMP to the brain for the first time. The team focused on the hippocampus, in part because it’s already well-studied and the results could be verified.
“This gave us an entirely different angle to look at the hippocampus, and we found a lot of new and exciting things,” said co-corresponding author Giordano Lippi, associate professor of neuroscience at Scripps Research. “This sort of foundational work is needed to eventually understand what goes wrong at the onset of brain diseases.”
Ribo-STAMP detects BDNF-induced translational dynamics
a, Experimental paradigm. b, IGV browser tracks showing counts and edit peaks for Camk2a in non-treated and BDNF-treated primary neurons, with mean EPR levels (right). Edit peaks shown as percentage of edited Cs. c, EPR and RNA differential expression analysis comparing 60′ BDNF-induced and no treatment. Significant EPR change: two-sided t-test; P < 0.05; log2FC > 0.5 or < −0.5. Significant RNA change: Wald test; Benjamini–Hochberg correction; P < 0.01; log2FC > 1 or < −1. Validation candidates highlighted in red. d, EPR and TPM for candidates normalized to no treatment (NT) = 1. The shaded area is s.e.m. e, Puro-PLA representative images. f, Quantification of Puro-PLA positive area from e as percentage of MAP2 cell area. Cell numbers (in columns) over n = 3 biologically independent experiments. g, SynGO analysis of BDNF ‘EPR up’ (log2FC > 0.5; P < 0.05; two-sided t-test) genes. One-sided Fisher’s exact test and Benjamini–Hochberg correction. h, Comparison of example presynaptic and postsynaptic term enrichment from ‘EPR up’ and ‘EPR not up’ SynGO analyses. i, Number of unique presynaptic and postsynaptic genes found in ‘EPR up’ and ‘EPR not up’, and number of shared genes. j, EPR levels of genes in i. k, Comparison of CDS and 5′ UTR length among the gene lists in h and i combined (‘EPR up’ + ‘EPR not up’). All synaptic ‘EPR not up’ n = 818, all synaptic ‘EPR up’ n = 192, unique postsynaptic n = 139 and unique presynaptic n = 170 genes. Box plots show the interquartile range, with the line inside marking the median. Whiskers extend up to 1.5 times the interquartile range from the lower and upper quartiles. Bars represent mean ± s.e.m. (f,j). Kruskal–Wallis test followed by Tukey’s multiple comparison post hoc test (f); GRIP1, Padjust < 0.0001; SNAP25, no treatment versus BDNF 60′ Padjust = 0.0003; BDNF 15′ versus BDNF 60′ Padjust < 0.0001; SHANK3, Padjust = 0.0369. Two-sided Mann–Whitney U-test (j,k). Top, P = 0.002; bottom, P = 0.0008 (j). Top, P = 0.02414; bottom left, P = 1.322 × 10⁻⁶ (k). *P < 0.05; **P < 0.01; ***P < 0.001; ****P < 0.0001. Scale bars, 500 bp (b), 20 μm (e).
When they measured translation in nearly 20,000 individual cells in the mouse hippocampus, they observed some unexpected patterns beyond what was known.
One of the most surprising findings came from comparing two types of neurons critical for memory: CA1 and CA3 pyramidal cells. Despite their similar roles in memory circuits, CA3 neurons showed much higher rates of protein production than CA1 neurons. The findings not only reveal that the pyramidal cell types are less similar than previously believed, but they also suggest an important role for translation in how circuits in the brain coordinate memory.
This study also indicated how different mRNA molecules made from the same gene, known as isoforms, affect how much of the corresponding protein is produced. The researchers, including co-first authors Samantha Sison and Eric Kofman at UC San Diego School of Medicine, and Federico Zampa at Scripps Research, discovered that in hippocampal neurons, isoforms with longer regulatory regions tended to be translated into proteins at a higher rate. Understanding this link better could shed light on how variations in mRNA transcripts could contribute to disease.
“Previous work has shown how changes in isoform expression strongly correlates with neurological disorders, but the reason behind that hasn’t been well-understood,” says Lippi. “Our work suggests that if cells prefer one isoform over another, they may actually be changing protein levels.”
Beyond differences between cell types, the researchers discovered that individual neurons can exist in “high” and “low” translation states, producing proteins at dramatically different rates. Neurons in the high translation state tended to make proteins involved in communication between neurons and energy production, hinting that translation states might distinguish more active neurons from quieter ones.
Yeo said that their dataset on the brain’s “translatome” — the full set of mRNAs that are translated into proteins — is just the beginning of a new understanding of how healthy brain cells coordinate protein production, and what that means for disease.
Source – UC San Diego
Sison SL, Zampa F, Kofman ER, Choi SY, Jagannatha P, Nguyen GG, Naritomi JT, Shin A, Khorgade A, Jin W, Chen CY, Sievert DM, Mukhopadhyay S, Mizrahi O, Blue SM, Marina RJ, Yang D, Wang CC, Pang Z, Brannan KW, Ye L, Al’Khafaji AM, Yeo GW, Lippi G. (2026) Single-cell and isoform-specific translational profiling of the mouse brain. Nature [Epub ahead of print]. [article]
Related Posts
Recent Posts
 Scientists identify the neuroblastoma cells that signal poor outcomes
 GARAGE improves rare cell detection in single-cell RNA sequencing analysis using AI
 Machine learning reveals how RNA splicing is regulated in individual cell types
 Illumina releases SpliceAI2 to help advance rare disease research
 Postdoctoral Fellow – Long-Read RNA Methods Development for Neurodegeneration
 Novel biosensor uses DNA ‘barcodes’ to uncover disease signals in cells
RNA-Seq Products & Services



Stay Connected