

Understanding how genetic variants affect our cells is one of the biggest challenges in biology. Some changes in DNA can disrupt how genes function, which may lead to diseases such as cancer. But connecting specific DNA variants to their effects on gene activity has been difficult because the tools available have been limited.
Researchers from the European Molecular Biology Laboratory have developed a new method called single-cell DNA-RNA sequencing (SDR-seq). This technique allows scientists to analyze both DNA and RNA from thousands of single cells at once. By doing so, they can see not only which variants are present, but also how those variants affect gene expression.
In their work, the team used SDR-seq to study human stem cells and cancer samples. They discovered that certain genetic variants, including ones outside of genes (noncoding), can strongly influence how cells behave. In lymphoma samples, for example, cells with more mutations showed stronger activity in cancer-related pathways.
SDR-seq is sensitive to detect gene expression changes and link them to variants
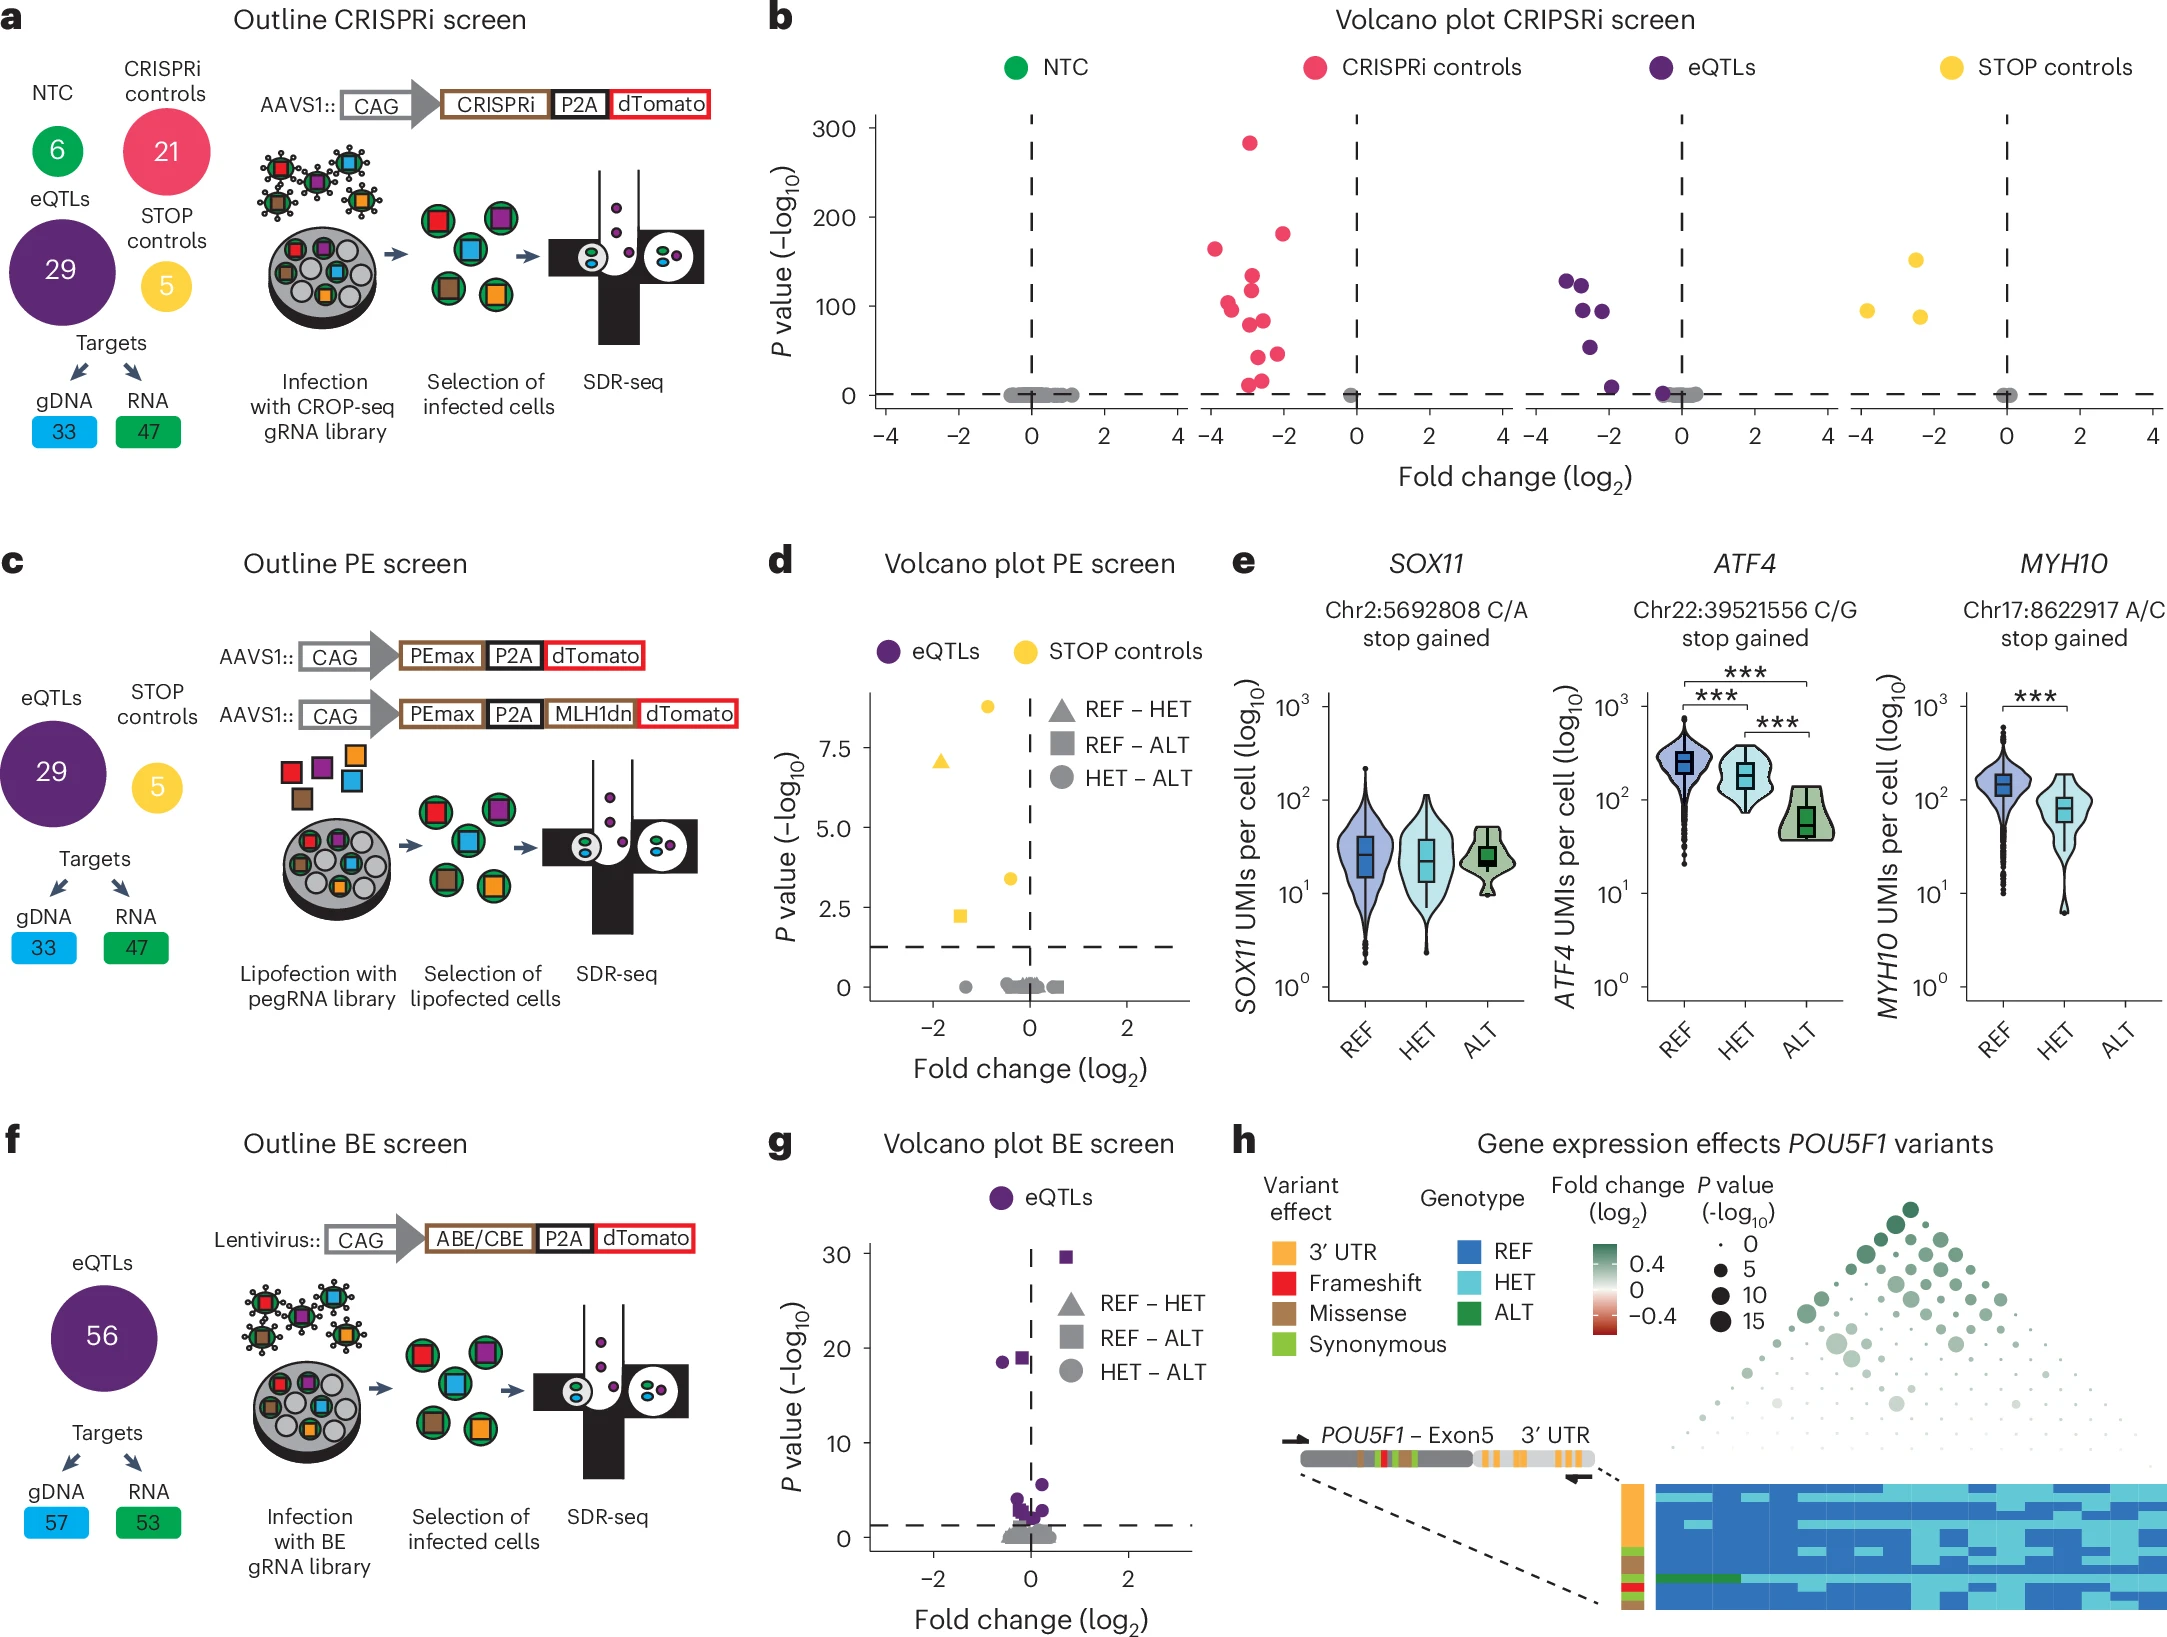
a, Outline of the CRISPRi screen. b, Volcano plot for the CRISPRi screen with different gRNA classes indicating fold change and P value calculated using MAST with a Benjamini–Hochberg correction for multiple testing. Significant hits (P < 0.05) are colored. For NTCs, all genes measured are shown. For other gRNA classes, only the intended target for each gRNA is shown. c, Outline of the PE screen. d, Volcano plot for the PE screen with different gRNA classes indicating fold change and P value calculated using MAST with a Benjamini–Hochberg correction for multiple testing. Significant hits (P < 0.05) are colored. Comparisons between the different alleles are shown as shapes; REF, reference allele; HET, heterozygous allele; ALT, alternative allele. e, Alleles and gene expression for SOX11, ATF4 and MYH10 STOP controls are shown; **P < 10−3 and ***P < 10−4 calculated using MAST with a Benjamini–Hochberg correction for multiple testing; n = 4,152 (SOX11: REF), 117 (SOX11: HET), 9 (SOX11: ALT), 4,916 (ATF4: REF), 53 (ATF4: HET), 4 (ATF4: ALT), 4,925 (MYH10: REF) and 18 cells (MYH10: HET) from one SDR-seq experiment; P = 3.05 × 10⁻⁴ (ATF4: REF–HET), 5.38 × 10⁻⁸ (ATF4: REF–ALT), 4.95 × 10⁻³ (ATF4: HET–ALT) and 7.90 × 10⁻¹⁰ (MYH10: REF–HET). f, Outline of the BE screen. g, Volcano plot for different gRNA classes indicating fold change and P value calculated using MAST with a Benjamini–Hochberg correction for multiple testing. Significant hits (P < 0.05) are colored. Comparisons between the different alleles are shown as shapes. h, Variants in the POU5F1 locus and their impact on gene expression are shown; UTR, untranslated region. The impact of each variant is color coded. REF, HET and ALT alleles are shown for each genotype. Fold change between the combination of variants is indicated in color (green), and P value (–log10) is indicated as size calculated using MAST with a Benjamini–Hochberg correction for multiple testing.
This breakthrough makes it possible to better understand how hidden changes in DNA affect gene regulation and disease progression. It is a step toward linking genetic information directly to cell behavior, which could ultimately improve the way we study and treat complex diseases.
Availability – Code containing SDRranger to generate count/read matrices from RNA or gDNA raw sequencing data is available under https://github.com/hawkjo/SDRranger. Code for TAP-seq prediction, generation of custom STAR references and processing of the data is available under https://github.com/DLindenhofer/SDR-seq.
Lindenhofer D, Bauman JR, Hawkins JA, Fitzgerald D, Yildiz U, Jung H, Korosteleva A, Marttinen M, Kueblbeck M, Zaugg JB, Noh KM, Dietrich S, Huber W, Stegle O, Steinmetz LM. (2025) Functional phenotyping of genomic variants using joint multiomic single-cell DNA-RNA sequencing. Nature Methods 2025(Sep 1). [article]
Related Posts




Understanding how genetic variants affect our cells is one of the biggest challenges in biology. Some changes in DNA can disrupt how genes function, which may lead to diseases such as cancer. But connecting specific DNA variants to their effects on gene activity has been difficult because the tools available have been limited.
Researchers from the European Molecular Biology Laboratory have developed a new method called single-cell DNA-RNA sequencing (SDR-seq). This technique allows scientists to analyze both DNA and RNA from thousands of single cells at once. By doing so, they can see not only which variants are present, but also how those variants affect gene expression.
In their work, the team used SDR-seq to study human stem cells and cancer samples. They discovered that certain genetic variants, including ones outside of genes (noncoding), can strongly influence how cells behave. In lymphoma samples, for example, cells with more mutations showed stronger activity in cancer-related pathways.
SDR-seq is sensitive to detect gene expression changes and link them to variants
a, Outline of the CRISPRi screen. b, Volcano plot for the CRISPRi screen with different gRNA classes indicating fold change and P value calculated using MAST with a Benjamini–Hochberg correction for multiple testing. Significant hits (P < 0.05) are colored. For NTCs, all genes measured are shown. For other gRNA classes, only the intended target for each gRNA is shown. c, Outline of the PE screen. d, Volcano plot for the PE screen with different gRNA classes indicating fold change and P value calculated using MAST with a Benjamini–Hochberg correction for multiple testing. Significant hits (P < 0.05) are colored. Comparisons between the different alleles are shown as shapes; REF, reference allele; HET, heterozygous allele; ALT, alternative allele. e, Alleles and gene expression for SOX11, ATF4 and MYH10 STOP controls are shown; **P < 10−3 and ***P < 10−4 calculated using MAST with a Benjamini–Hochberg correction for multiple testing; n = 4,152 (SOX11: REF), 117 (SOX11: HET), 9 (SOX11: ALT), 4,916 (ATF4: REF), 53 (ATF4: HET), 4 (ATF4: ALT), 4,925 (MYH10: REF) and 18 cells (MYH10: HET) from one SDR-seq experiment; P = 3.05 × 10⁻⁴ (ATF4: REF–HET), 5.38 × 10⁻⁸ (ATF4: REF–ALT), 4.95 × 10⁻³ (ATF4: HET–ALT) and 7.90 × 10⁻¹⁰ (MYH10: REF–HET). f, Outline of the BE screen. g, Volcano plot for different gRNA classes indicating fold change and P value calculated using MAST with a Benjamini–Hochberg correction for multiple testing. Significant hits (P < 0.05) are colored. Comparisons between the different alleles are shown as shapes. h, Variants in the POU5F1 locus and their impact on gene expression are shown; UTR, untranslated region. The impact of each variant is color coded. REF, HET and ALT alleles are shown for each genotype. Fold change between the combination of variants is indicated in color (green), and P value (–log10) is indicated as size calculated using MAST with a Benjamini–Hochberg correction for multiple testing.
This breakthrough makes it possible to better understand how hidden changes in DNA affect gene regulation and disease progression. It is a step toward linking genetic information directly to cell behavior, which could ultimately improve the way we study and treat complex diseases.
Availability – Code containing SDRranger to generate count/read matrices from RNA or gDNA raw sequencing data is available under https://github.com/hawkjo/SDRranger. Code for TAP-seq prediction, generation of custom STAR references and processing of the data is available under https://github.com/DLindenhofer/SDR-seq.
Lindenhofer D, Bauman JR, Hawkins JA, Fitzgerald D, Yildiz U, Jung H, Korosteleva A, Marttinen M, Kueblbeck M, Zaugg JB, Noh KM, Dietrich S, Huber W, Stegle O, Steinmetz LM. (2025) Functional phenotyping of genomic variants using joint multiomic single-cell DNA-RNA sequencing. Nature Methods 2025(Sep 1). [article]
Related Posts
Recent Posts
 Novel biosensor uses DNA ‘barcodes’ to uncover disease signals in cells
 GP-DHT uses single-cell RNA sequencing to map gene regulatory networks
 Boehringer taps Envisagenics’ AI to mine RNA splicing for cancer targets
 CellART extracts single-cell information from high-resolution spatial transcriptomics
 Cell2space restores spatial context to single-cell RNA sequencing data
 PacBio and TychoBio Collaborate to Train AI Models for Rare Disease
RNA-Seq Products & Services



Stay Connected