

Transcription factors are proteins that turn genes on or off by attaching to specific DNA sequences. For years, researchers have used high-throughput lab methods to figure out which DNA sequences these proteins prefer. However, many of these methods miss weaker binding sites, even though those sites play an important role in fine-tuning when and where genes turn on.
A team led by researchers at the Brigham and Women’s Hospital and Harvard Medical School developed a new method called PADIT-seq, short for protein affinity to DNA by in vitro transcription and RNA sequencing. This approach allowed them to examine how six transcription factors interact with every possible ten base pair DNA sequence. Because the technique is more sensitive to subtle interactions, it uncovered hundreds of previously unknown lower affinity binding sites.
PADIT-seq detects hundreds of lower-affinity interactions that are undetected by uPBM and HT-SELEX
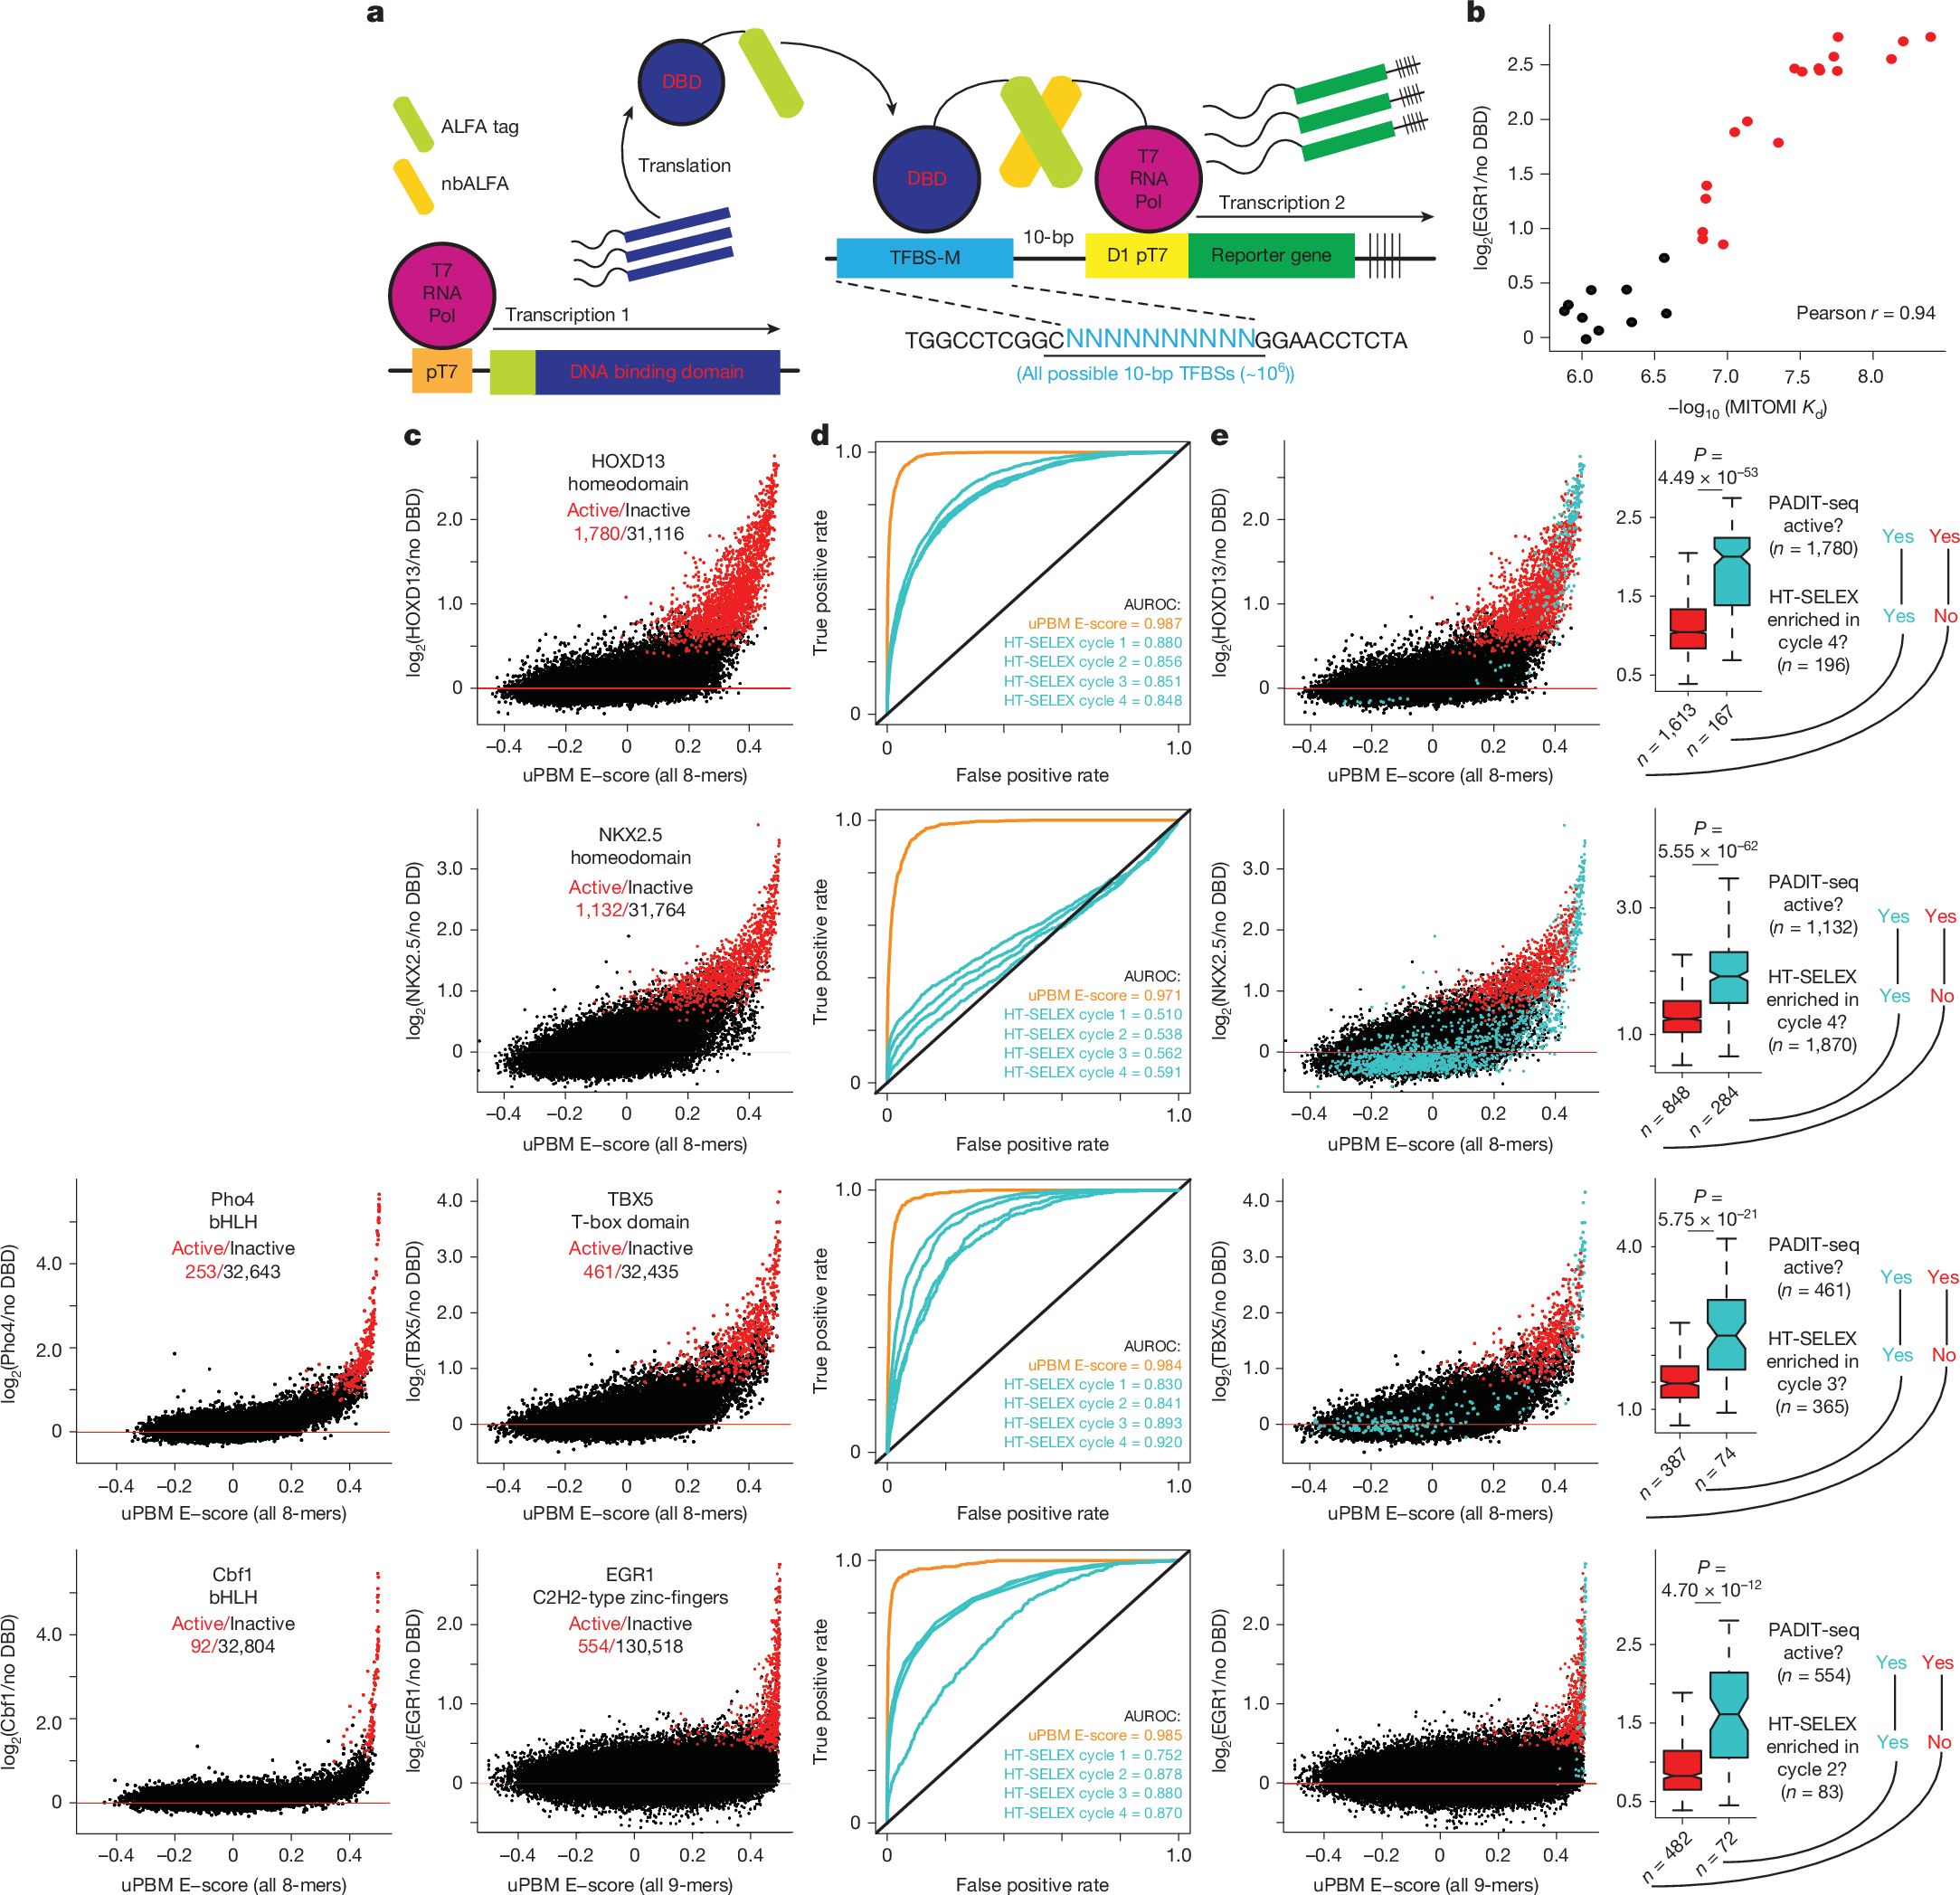
a, The PADIT-seq synthetic genetic circuit is shown with a reporter library containing all possible 10-bp DNA sequences as candidate TFBSs. b, EGR1 PADIT-seq activities are compared to MITOMI-derived dissociation constants (Kd). Active k-mers (red) are those that significantly increased reporter gene expression upon TF binding (FDR 5%). Inactive k-mers are coloured black. c, Comparison of binding preferences measured by uPBM E-scores and PADIT-seq for four human TFs (HOXD13, NKX2.5, TBX5 and EGR1) and two yeast TFs (Pho4 and Cbf1). Active k-mers are coloured red, and the ratio of active/inactive k-mers is shown for each TF. d, ROC curves comparing the ability of uPBM E-scores (orange) and HT-SELEX cycles 1–4 (blue) to discriminate between PADIT-seq active and inactive k-mers. The area under each ROC curve (AUROC) indicates the overall performance of each method, with values closer to 1 indicating better discrimination. HT-SELEX data were not available for the yeast TFs Pho4 and Cbf1. e, Left, same data as in c, with blue points indicating k-mers that were significantly enriched in the specified HT-SELEX cycle. Right, box plots comparing PADIT-seq activities between active k-mers that were enriched (blue) or not enriched (red) in HT-SELEX. The bounds of the box plots define the 25th, 50th and 75th percentiles, and whiskers extend to the furthest data points within 1.5× the interquartile range. Statistical significance was determined by two-sided Wilcoxon rank sum tests.
What they found changes how we think about gene regulation. Instead of a transcription factor binding to one isolated high affinity site, the DNA around that site contains many overlapping lower affinity sites. Together, these overlapping regions influence how strongly and how often a transcription factor attaches to DNA in living cells.
The team proposes that transcription factor occupancy is determined by the combined effect of all these overlapping sites, not just a single strong one. This means that even a small change to DNA, such as a single nucleotide variant, can shift the number and arrangement of overlapping sites. That shift can alter gene expression in meaningful ways, including changes linked to human traits and diseases.
This overlapping binding model helps explain how related transcription factors compete for the same high affinity sites, why their activity differs, and how noncoding DNA variants can have far-reaching biological effects.
Availability – Code and processed data for generating the figures are available at https://github.com/BulykLab/PADIT-seq.
Khetan S, Carroll BS, Bulyk ML. (2025) Multiple overlapping binding sites determine transcription factor occupancy. Nature 646(8086):1001-1011. [article]
Related Posts




Transcription factors are proteins that turn genes on or off by attaching to specific DNA sequences. For years, researchers have used high-throughput lab methods to figure out which DNA sequences these proteins prefer. However, many of these methods miss weaker binding sites, even though those sites play an important role in fine-tuning when and where genes turn on.
A team led by researchers at the Brigham and Women’s Hospital and Harvard Medical School developed a new method called PADIT-seq, short for protein affinity to DNA by in vitro transcription and RNA sequencing. This approach allowed them to examine how six transcription factors interact with every possible ten base pair DNA sequence. Because the technique is more sensitive to subtle interactions, it uncovered hundreds of previously unknown lower affinity binding sites.
PADIT-seq detects hundreds of lower-affinity interactions that are undetected by uPBM and HT-SELEX
a, The PADIT-seq synthetic genetic circuit is shown with a reporter library containing all possible 10-bp DNA sequences as candidate TFBSs. b, EGR1 PADIT-seq activities are compared to MITOMI-derived dissociation constants (Kd). Active k-mers (red) are those that significantly increased reporter gene expression upon TF binding (FDR 5%). Inactive k-mers are coloured black. c, Comparison of binding preferences measured by uPBM E-scores and PADIT-seq for four human TFs (HOXD13, NKX2.5, TBX5 and EGR1) and two yeast TFs (Pho4 and Cbf1). Active k-mers are coloured red, and the ratio of active/inactive k-mers is shown for each TF. d, ROC curves comparing the ability of uPBM E-scores (orange) and HT-SELEX cycles 1–4 (blue) to discriminate between PADIT-seq active and inactive k-mers. The area under each ROC curve (AUROC) indicates the overall performance of each method, with values closer to 1 indicating better discrimination. HT-SELEX data were not available for the yeast TFs Pho4 and Cbf1. e, Left, same data as in c, with blue points indicating k-mers that were significantly enriched in the specified HT-SELEX cycle. Right, box plots comparing PADIT-seq activities between active k-mers that were enriched (blue) or not enriched (red) in HT-SELEX. The bounds of the box plots define the 25th, 50th and 75th percentiles, and whiskers extend to the furthest data points within 1.5× the interquartile range. Statistical significance was determined by two-sided Wilcoxon rank sum tests.
What they found changes how we think about gene regulation. Instead of a transcription factor binding to one isolated high affinity site, the DNA around that site contains many overlapping lower affinity sites. Together, these overlapping regions influence how strongly and how often a transcription factor attaches to DNA in living cells.
The team proposes that transcription factor occupancy is determined by the combined effect of all these overlapping sites, not just a single strong one. This means that even a small change to DNA, such as a single nucleotide variant, can shift the number and arrangement of overlapping sites. That shift can alter gene expression in meaningful ways, including changes linked to human traits and diseases.
This overlapping binding model helps explain how related transcription factors compete for the same high affinity sites, why their activity differs, and how noncoding DNA variants can have far-reaching biological effects.
Availability – Code and processed data for generating the figures are available at https://github.com/BulykLab/PADIT-seq.
Khetan S, Carroll BS, Bulyk ML. (2025) Multiple overlapping binding sites determine transcription factor occupancy. Nature 646(8086):1001-1011. [article]
Related Posts
Recent Posts
 RNAmel simplifies RNA sequencing data analysis with a reproducible, integrated platform
 Heart failure reshapes bone marrow to create inflammation-related immune memory
 Overlooked DNA regions surrounding ‘microexons’ hold missing pieces of autism’s genetic puzzle
 RiboBA improves detection of hidden protein-coding regions using ribosome profiling
 An anti-senescence gene may fight spinal disc deterioration
 Bulk RNA-seq Analysis: A Complete Beginner’s Guide
RNA-Seq Products & Services


Stay Connected