

Understanding how cells grow and divide requires looking at both their DNA and RNA. Single-cell sequencing has given scientists a powerful way to explore differences between individual cells, but many existing methods cannot track how gene activity changes as cells progress through the S-phase of the cell cycle, when DNA is being copied. Researchers at the RIKEN Center for Biosystems Dynamics Research (BDR), Japan have developed a new method called scRepli-RamDA-seq, or scRR-seq, to address this gap.
scRR-seq enables scRepli-seq and scRamDA-seq from the same single cell
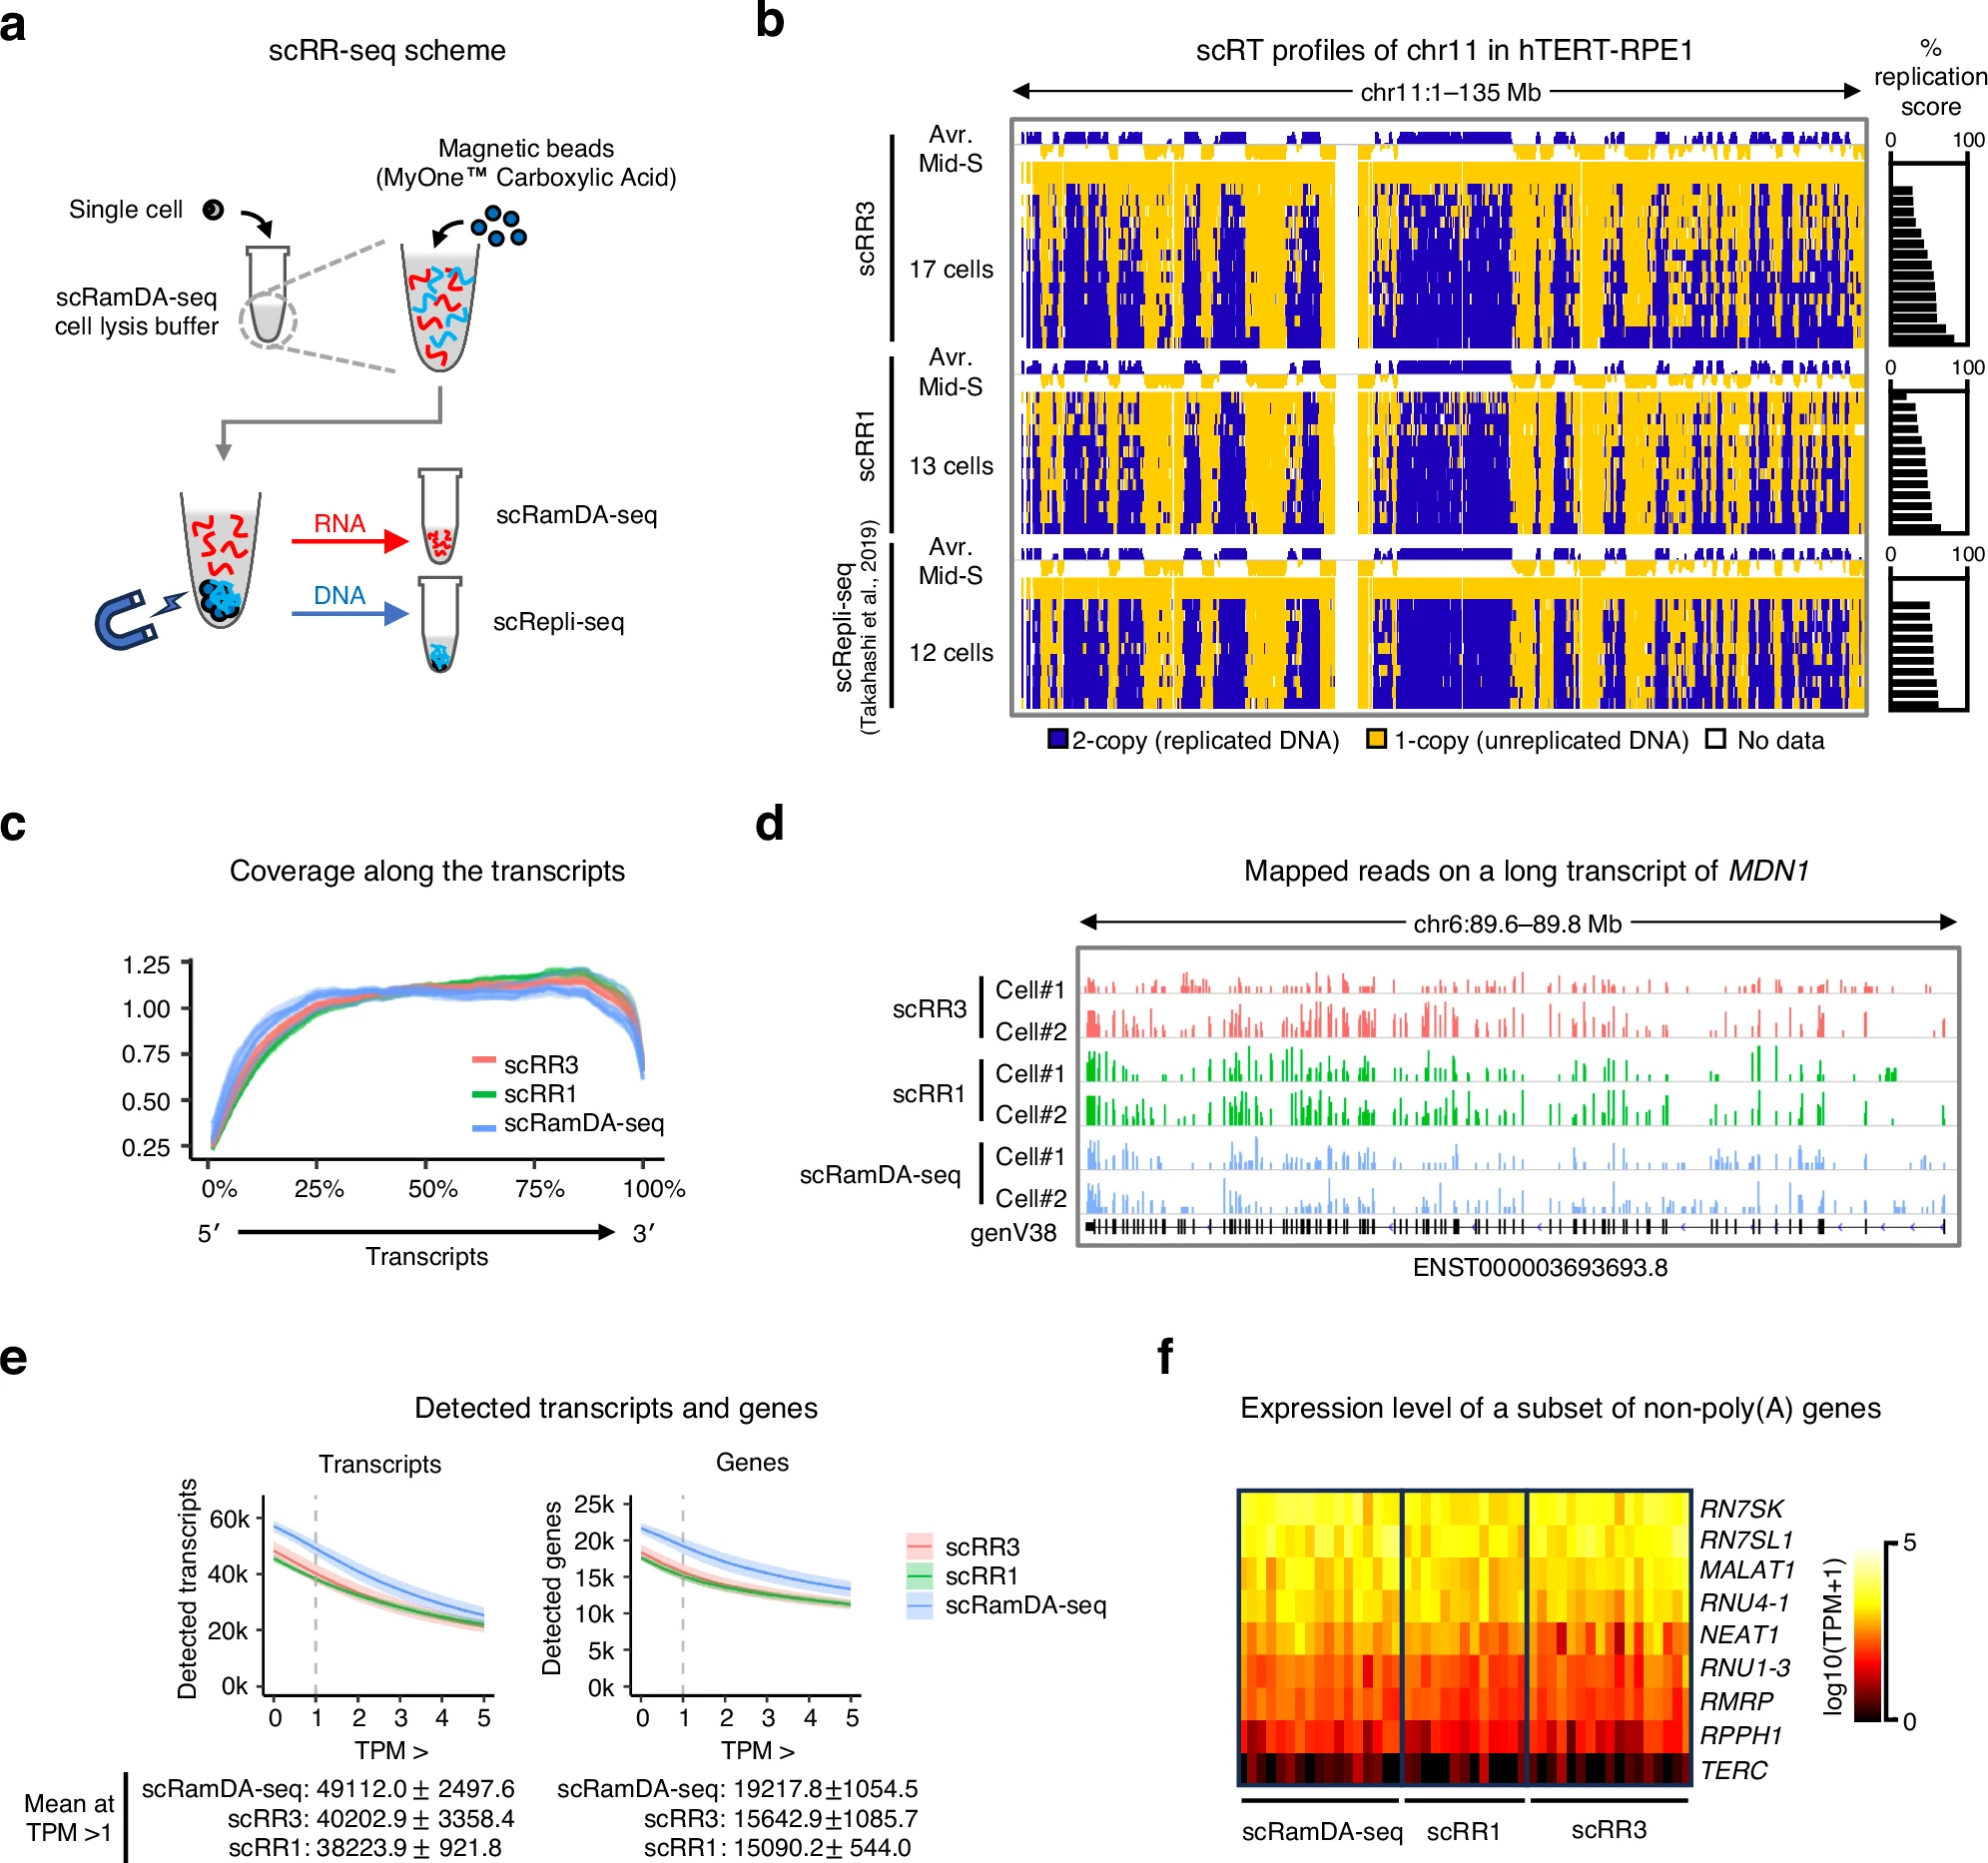
a Schematic of the scRR-seq method. b Comparison of mid-S hTERT-RPE1 scRT profiles derived from scRR-seq (scRR3 and scRR1) and scRepli-seq. Chromosome 11 (chr11) is shown. The average mid-S RT profiles (Avr. Mid-S) are derived from cells with 40–70% replication scores. Yellow and blue represent unreplicated and replicated bins, respectively; white represents bins with no data. c Average of coverage along transcripts. d Comparison of scRR-seq and scRamDA-seq mapped reads on a representative long transcript, MDN1 (~ 190 kb). e Detection rates of transcripts and genes expressed in mid-S-phase hTERT-RPE1 cells, across different expression level thresholds for each method. Here, transcripts refer to all RNA molecules transcribed from a given gene, including splicing variants, while genes are unique and their expression levels represent the sum of all transcripts assigned to each gene. The line and color-shaded areas represent means and standard deviations (SDs), respectively. The values at the bottom indicate the mean number of transcripts or genes with SDs at transcript per million (TPM) > 1. f The ability to detect known non-poly(A) genes was comparable across the three methods tested. Each row represents a non-poly(A) gene. Each column represents a sample derived from the indicated method. Gene expression levels [log10(TPM + 1)] are shown using the color scale in the figure.
scRR-seq is a multi-omics technique that simultaneously measures DNA replication and full-length RNA sequences in the same single cell. This allows researchers to determine which stage of S-phase a cell is in by looking at how much of its genome has been replicated. By combining DNA replication data with RNA sequencing, scRR-seq can track gene expression dynamics throughout S-phase and identify markers that indicate progression through this critical phase of the cell cycle.
In addition to monitoring S-phase, scRR-seq can detect copy-number variations in cells that are not currently replicating their DNA and outperforms other single-cell DNA/RNA sequencing methods in multiple measures of accuracy and resolution. With this approach, scientists can perform more comprehensive analyses of both the genome and transcriptome in single cells, offering new insights into cellular processes, disease mechanisms, and potential therapeutic targets.
Availability – The code used for data analysis in this study is publicly available on GitHub at: https://github.com/mcbmieu/scRR-seq
Poonperm R, Yoneda T, Imada T, Takahashi S, Ichinose T, Miura H, Hayashi T, Kuse M, Yoshimura M, Nagao K, Obuse C, Nikaido I, Hiratani I, Takebayashi SI, (2025) scRepli-RamDA-seq: a multi-omics technology enabling the analysis of gene expression dynamics during S-phase. Nature Communications 16(1): 10902. [article]
Related Posts




Understanding how cells grow and divide requires looking at both their DNA and RNA. Single-cell sequencing has given scientists a powerful way to explore differences between individual cells, but many existing methods cannot track how gene activity changes as cells progress through the S-phase of the cell cycle, when DNA is being copied. Researchers at the RIKEN Center for Biosystems Dynamics Research (BDR), Japan have developed a new method called scRepli-RamDA-seq, or scRR-seq, to address this gap.
scRR-seq enables scRepli-seq and scRamDA-seq from the same single cell
a Schematic of the scRR-seq method. b Comparison of mid-S hTERT-RPE1 scRT profiles derived from scRR-seq (scRR3 and scRR1) and scRepli-seq. Chromosome 11 (chr11) is shown. The average mid-S RT profiles (Avr. Mid-S) are derived from cells with 40–70% replication scores. Yellow and blue represent unreplicated and replicated bins, respectively; white represents bins with no data. c Average of coverage along transcripts. d Comparison of scRR-seq and scRamDA-seq mapped reads on a representative long transcript, MDN1 (~ 190 kb). e Detection rates of transcripts and genes expressed in mid-S-phase hTERT-RPE1 cells, across different expression level thresholds for each method. Here, transcripts refer to all RNA molecules transcribed from a given gene, including splicing variants, while genes are unique and their expression levels represent the sum of all transcripts assigned to each gene. The line and color-shaded areas represent means and standard deviations (SDs), respectively. The values at the bottom indicate the mean number of transcripts or genes with SDs at transcript per million (TPM) > 1. f The ability to detect known non-poly(A) genes was comparable across the three methods tested. Each row represents a non-poly(A) gene. Each column represents a sample derived from the indicated method. Gene expression levels [log10(TPM + 1)] are shown using the color scale in the figure.
scRR-seq is a multi-omics technique that simultaneously measures DNA replication and full-length RNA sequences in the same single cell. This allows researchers to determine which stage of S-phase a cell is in by looking at how much of its genome has been replicated. By combining DNA replication data with RNA sequencing, scRR-seq can track gene expression dynamics throughout S-phase and identify markers that indicate progression through this critical phase of the cell cycle.
In addition to monitoring S-phase, scRR-seq can detect copy-number variations in cells that are not currently replicating their DNA and outperforms other single-cell DNA/RNA sequencing methods in multiple measures of accuracy and resolution. With this approach, scientists can perform more comprehensive analyses of both the genome and transcriptome in single cells, offering new insights into cellular processes, disease mechanisms, and potential therapeutic targets.
Availability – The code used for data analysis in this study is publicly available on GitHub at: https://github.com/mcbmieu/scRR-seq
Poonperm R, Yoneda T, Imada T, Takahashi S, Ichinose T, Miura H, Hayashi T, Kuse M, Yoshimura M, Nagao K, Obuse C, Nikaido I, Hiratani I, Takebayashi SI, (2025) scRepli-RamDA-seq: a multi-omics technology enabling the analysis of gene expression dynamics during S-phase. Nature Communications 16(1): 10902. [article]
Related Posts
Recent Posts
 RNAmel simplifies RNA sequencing data analysis with a reproducible, integrated platform
 Heart failure reshapes bone marrow to create inflammation-related immune memory
 Overlooked DNA regions surrounding ‘microexons’ hold missing pieces of autism’s genetic puzzle
 RiboBA improves detection of hidden protein-coding regions using ribosome profiling
 An anti-senescence gene may fight spinal disc deterioration
 Bulk RNA-seq Analysis: A Complete Beginner’s Guide
RNA-Seq Products & Services



Stay Connected