

Researchers are gaining a clearer picture of how T cells, the body’s key defenders in the immune system, actually work. T cells are known for recognizing threats like viruses or cancer cells and then turning on specific genetic programs that allow them to multiply, attack, and send signals to other immune cells. Traditionally, scientists believed that T cells fell into neat categories like TH1, TH2, or TH17, each with its own fixed function.
However, single-cell RNA sequencing has shown that T cells exist along a spectrum of states rather than being locked into strict types. To better understand this complexity, researchers at the Brigham and Women’s Hospital and Harvard Medical School have developed a new tool called T-CellAnnoTator, or TCAT. This pipeline can analyze massive datasets and identify genetic programs that reflect how T cells are activated, exhausted, or prepared to fight.
Overview of starCAT
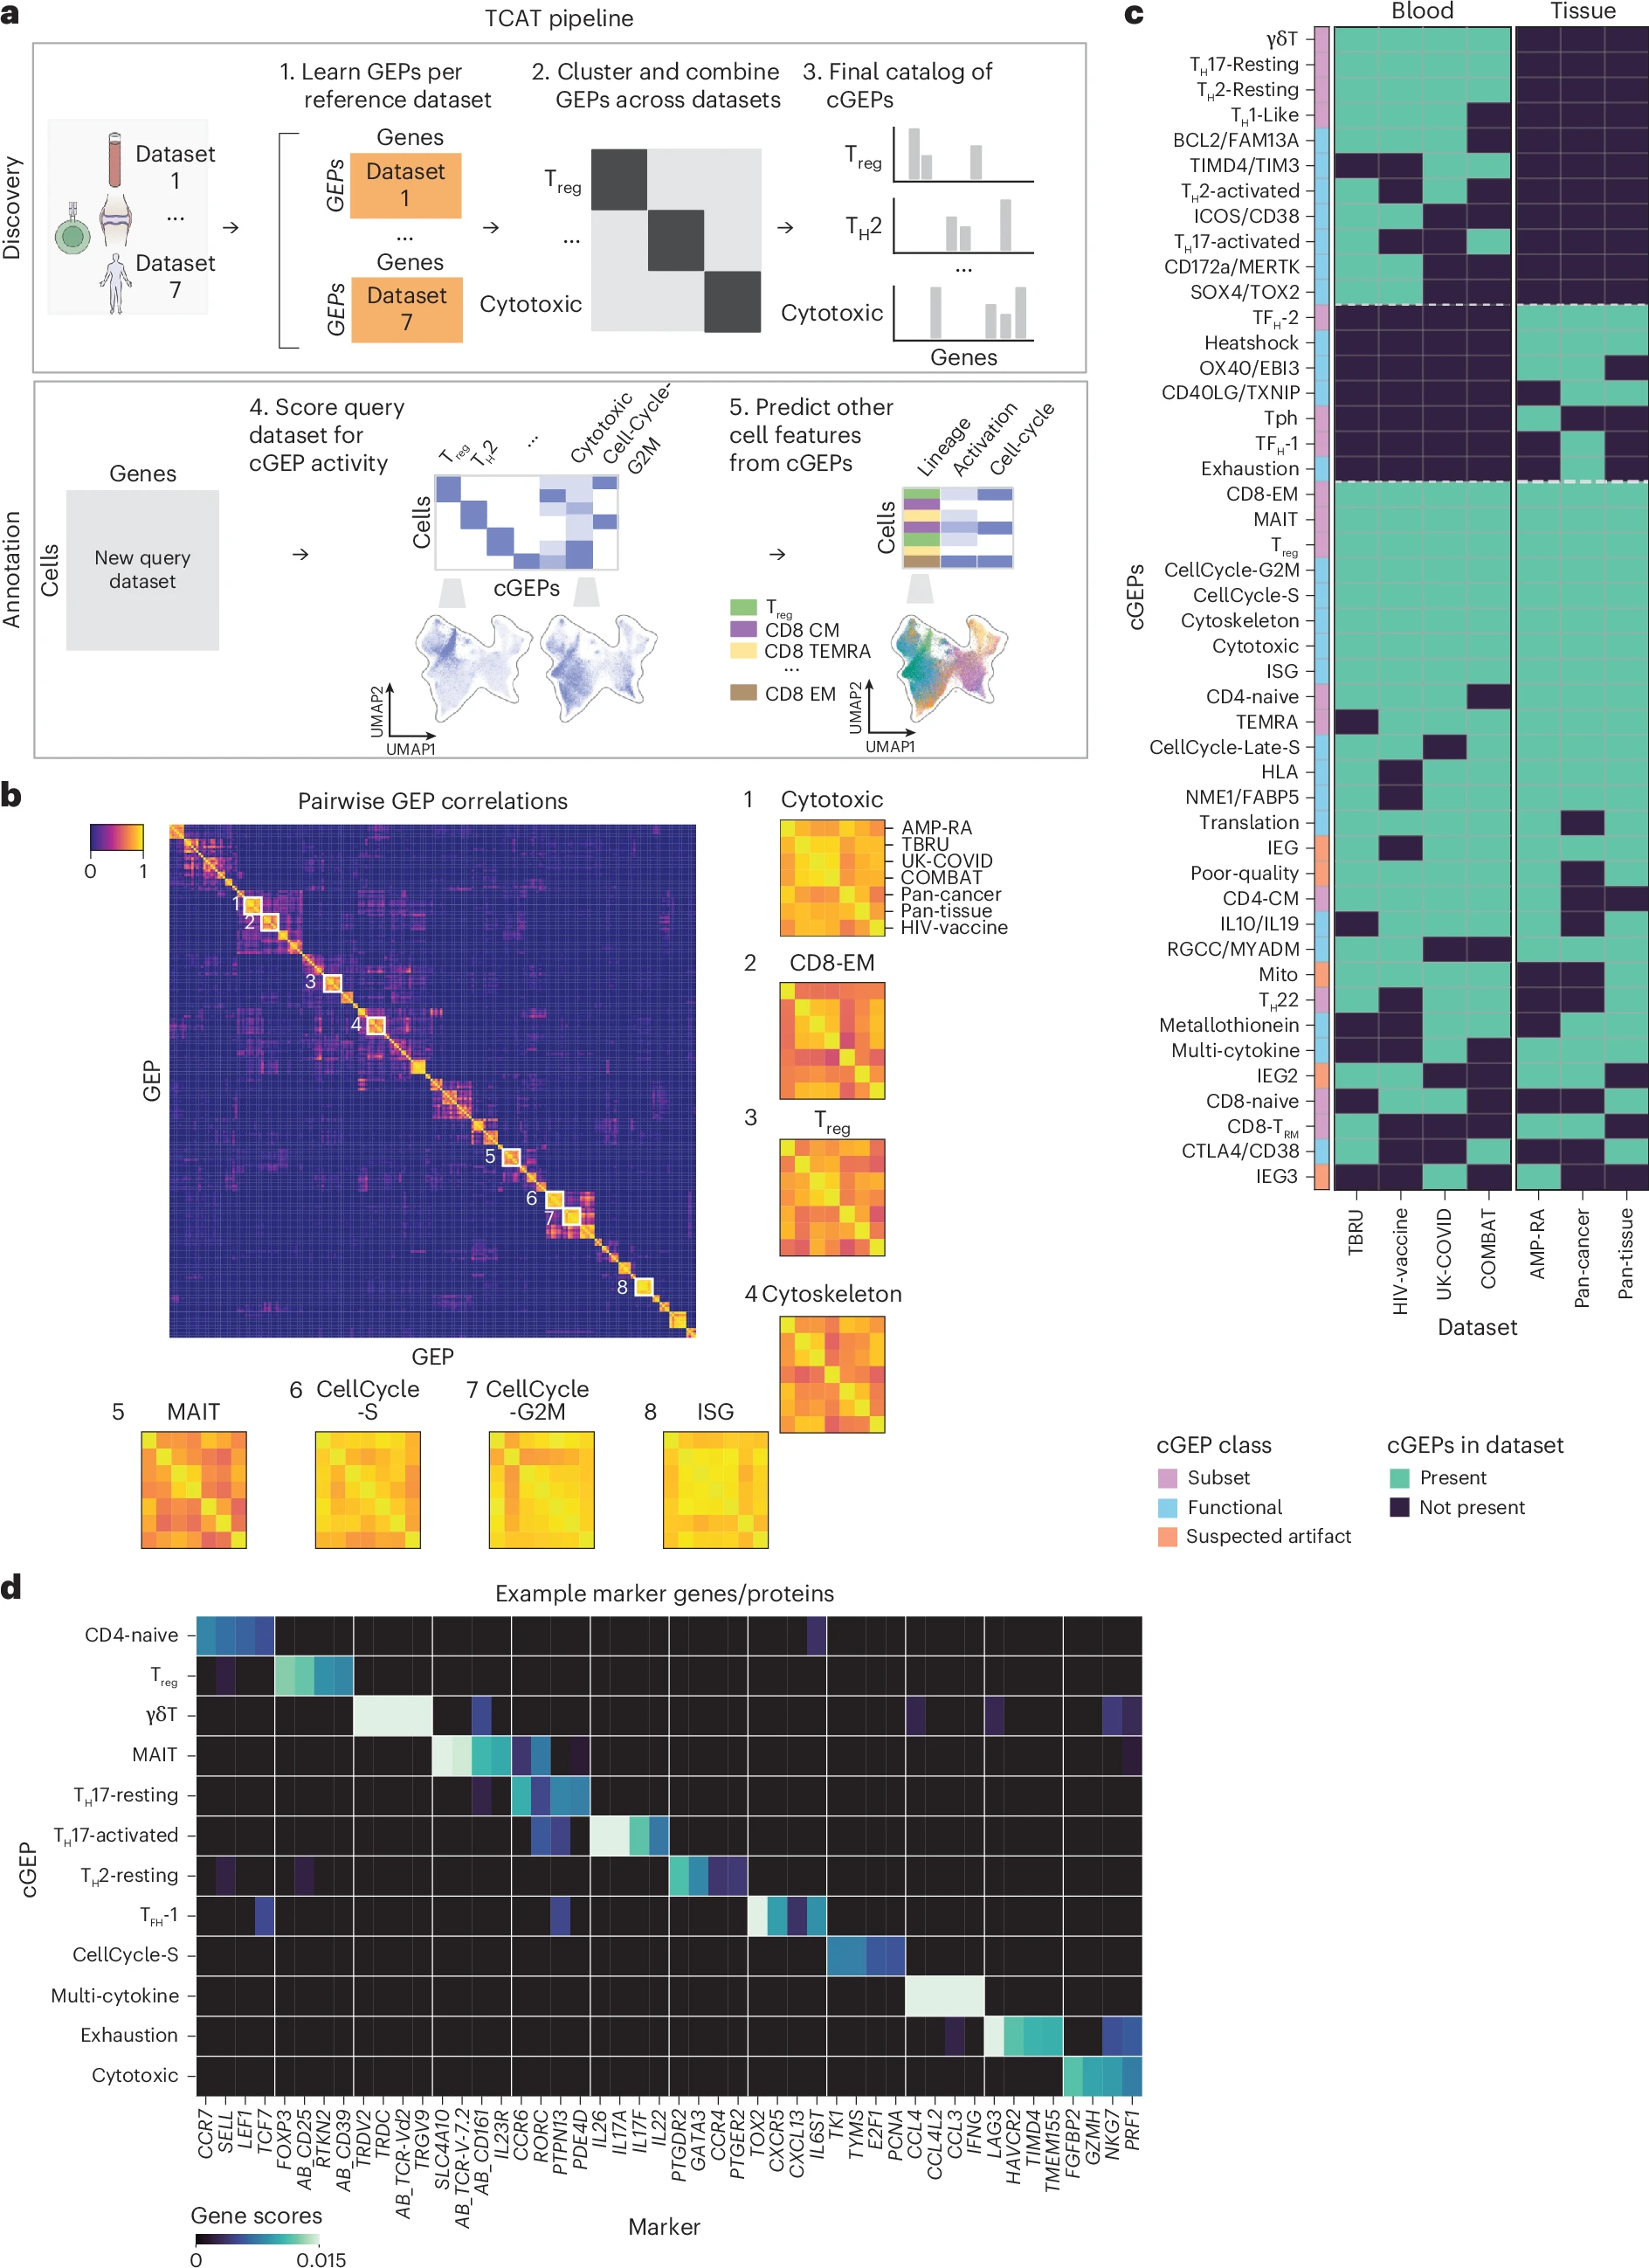
a, starCAT first identifies GEPs in multiple datasets and aggregates them into cGEPs. It then uses the cGEPs to annotate new query datasets and compute additional scores and classifiers. b, Pairwise correlations of GEPs discovered across reference datasets with insets for cGEPs derived from all seven references. Inset row and column orders are the same for all cGEPs. c, Heat map of cGEPs (rows) and which datasets the comprising GEPs were found in (columns). Green boxes indicate a GEP was found in a dataset. Colored bar indicates the cGEP’s assigned class. cGEPs corresponding to non-T cell lineages are excluded. d, Marker genes for selected example cGEPs in z-score units with the minimum value fixed at 0. The AB_ prefix indicates a surface protein.
By analyzing 1.7 million T cells from 700 people across multiple tissues and diseases, the researchers identified 46 reproducible genetic programs linked to core immune functions. Importantly, they also discovered new activation patterns and showed that some of these programs could predict how patients respond to immune checkpoint inhibitors, a class of cancer therapies.
To make this work broadly useful, the researchers created a companion software package called starCAT that allows scientists to apply the same framework to other cell types and tissues. This resource opens up new opportunities to explore immune function and disease with unprecedented detail.
Availability – The code for starCAT is available at https://github.com/immunogenomics/starCAT/.
Kotliar D, Curtis M, Agnew R, Weinand K, Nathan A, Baglaenko Y, Zhao Y, Sabeti PC, Rao DA, Raychaudhuri S. (2024) Reproducible single cell annotation of programs underlying T-cell subsets, activation states, and functions. Nature Methods [Epub ahead of print]. [article]
Related Posts




Researchers are gaining a clearer picture of how T cells, the body’s key defenders in the immune system, actually work. T cells are known for recognizing threats like viruses or cancer cells and then turning on specific genetic programs that allow them to multiply, attack, and send signals to other immune cells. Traditionally, scientists believed that T cells fell into neat categories like TH1, TH2, or TH17, each with its own fixed function.
However, single-cell RNA sequencing has shown that T cells exist along a spectrum of states rather than being locked into strict types. To better understand this complexity, researchers at the Brigham and Women’s Hospital and Harvard Medical School have developed a new tool called T-CellAnnoTator, or TCAT. This pipeline can analyze massive datasets and identify genetic programs that reflect how T cells are activated, exhausted, or prepared to fight.
Overview of starCAT
a, starCAT first identifies GEPs in multiple datasets and aggregates them into cGEPs. It then uses the cGEPs to annotate new query datasets and compute additional scores and classifiers. b, Pairwise correlations of GEPs discovered across reference datasets with insets for cGEPs derived from all seven references. Inset row and column orders are the same for all cGEPs. c, Heat map of cGEPs (rows) and which datasets the comprising GEPs were found in (columns). Green boxes indicate a GEP was found in a dataset. Colored bar indicates the cGEP’s assigned class. cGEPs corresponding to non-T cell lineages are excluded. d, Marker genes for selected example cGEPs in z-score units with the minimum value fixed at 0. The AB_ prefix indicates a surface protein.
By analyzing 1.7 million T cells from 700 people across multiple tissues and diseases, the researchers identified 46 reproducible genetic programs linked to core immune functions. Importantly, they also discovered new activation patterns and showed that some of these programs could predict how patients respond to immune checkpoint inhibitors, a class of cancer therapies.
To make this work broadly useful, the researchers created a companion software package called starCAT that allows scientists to apply the same framework to other cell types and tissues. This resource opens up new opportunities to explore immune function and disease with unprecedented detail.
Availability – The code for starCAT is available at https://github.com/immunogenomics/starCAT/.
Kotliar D, Curtis M, Agnew R, Weinand K, Nathan A, Baglaenko Y, Zhao Y, Sabeti PC, Rao DA, Raychaudhuri S. (2024) Reproducible single cell annotation of programs underlying T-cell subsets, activation states, and functions. Nature Methods [Epub ahead of print]. [article]
Related Posts
Recent Posts
 Scientists identify the neuroblastoma cells that signal poor outcomes
 GARAGE improves rare cell detection in single-cell RNA sequencing analysis using AI
 Machine learning reveals how RNA splicing is regulated in individual cell types
 Illumina releases SpliceAI2 to help advance rare disease research
 Postdoctoral Fellow – Long-Read RNA Methods Development for Neurodegeneration
 Novel biosensor uses DNA ‘barcodes’ to uncover disease signals in cells
RNA-Seq Products & Services


Stay Connected