

Spatial transcriptomics allows researchers to measure gene activity while preserving information about where that activity occurs within a tissue. Unlike conventional RNA sequencing, which often analyzes RNA after cells or tissues have been mixed together, spatial transcriptomics can show which genes are active in particular cells and where those cells are located relative to their neighbors.
This spatial information can help researchers investigate how different cell types interact, how tissues are organized and how diseases alter the cellular environment. Newer spatial transcriptomics technologies can detect individual RNA molecules at resolutions approaching or even exceeding the size of a single cell. However, extracting accurate biological information from these measurements presents an important computational challenge.
Researchers at the University of California, Berkeley and the Weizmann Institute of Science have developed a computational model called resolVI to address one of these challenges.
Overview of resolVI
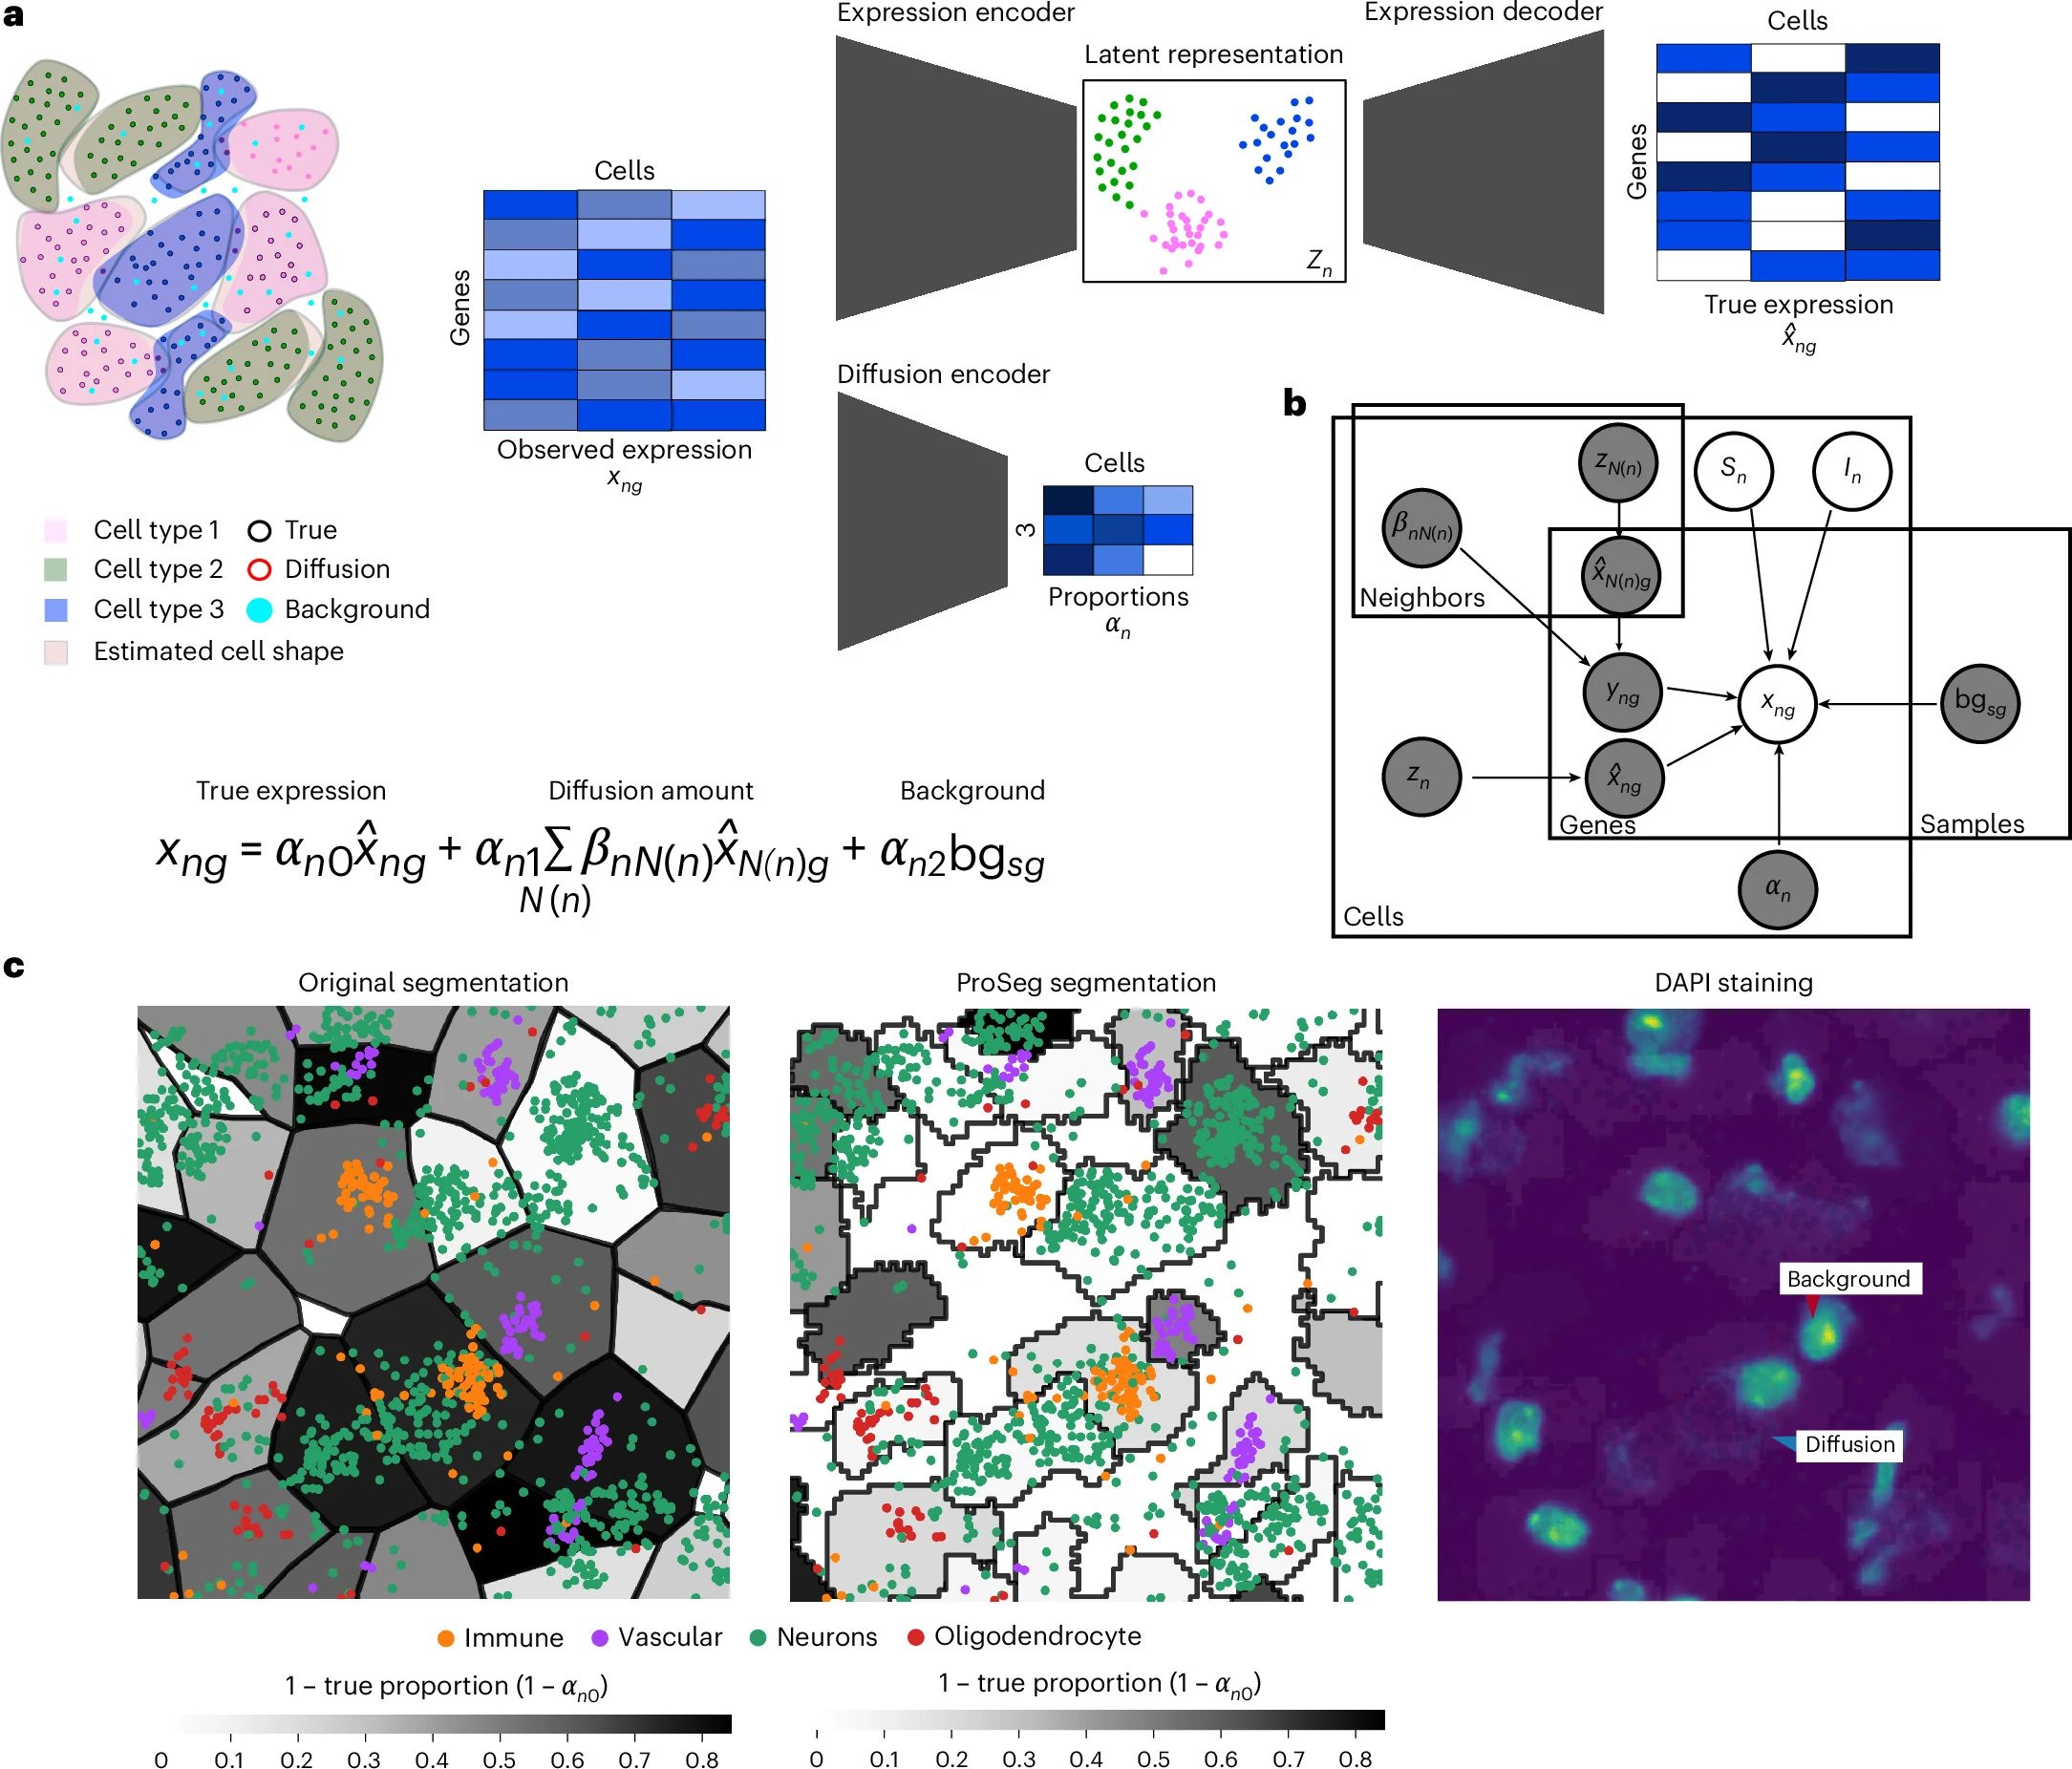
a, Schematic of the algorithm. To assign molecules to cells in ST, segmentation is performed. These algorithms do not fully capture the true cell shape. This leads to misassignment of molecules. In addition, unspecific background is present. Both phenomena contribute to the observed expression. The latent code of a cell and the contributions of ‘diffusion’ and ‘background’ to observed expression are estimated per cell using encoder networks. The latent code is decoded to yield the true expression. The mean observed expression is reconstructed as a sum over the estimated true expression, a weighted sum over the estimated true expression of neighboring cells to reconstruct diffusion and a per-sample background gene expression. We use a Poisson distribution for the background and a negative binomial distribution for diffusion and true expression (Methods). b, Plate model of resolVI. zn and zN(n) are the latent codes of the center cell and the neighboring cells, respectively, with N(n) being the neighboring cells of cell n. βnN(n) is the per-neighbor contribution, and denotes the gene expression of cells N(n). sn and ln are the sample ID and molecule count of cell n. and depend on the molecule count and sample ID. To simplify the plate model, the arrows are not displayed. yng is the total estimated gene expression due to diffusion summed over neighboring cells N(n), and bgsg is the estimated background of sample sn. Gray plates are latent parameters, while transparent ones are observed. In the semisupervised model, zn and zN(n) are dependent on the (partially) observed cell-type label of the respective cell-type label cn, and we additionally train a cell-type classifier that predicts cn from zn. c, Highlighted is a region of the mouse brain recorded with 10x Xenium. Displayed are the original 10x provided (left) and ProSeg (middle) segmentation. Molecules of cell-type marker genes are colored by their respective cell type. Black lines are segmentation boundaries, and cell shapes are colored by the estimated true proportion corresponding to the sum of background and diffusion, which are two distinct sources of nuisance. Right: the respective 4,6-diamidino-2-phenylindole (DAPI) image. We highlight one case of diffusion, where the boundary between an immune cell and a neuron is not clear, and one case of background, where a vascular cell contains sparse neuron-related transcripts.
Assigning RNA molecules to the correct cells
A spatial transcriptomics experiment can produce a map containing large numbers of RNA molecules distributed throughout a tissue section. To determine the gene expression profile of individual cells, computational methods first identify the boundaries of each cell, a process known as segmentation.
The RNA molecules located within those boundaries are then assigned to the corresponding cell. In principle, this produces a gene expression profile showing which genes are active in each individual cell.
In practice, cell boundaries are not always perfectly defined. Some RNA molecules may therefore be assigned to the wrong cell. These errors can be particularly important when neighboring cells have similar shapes or when RNA molecules lie close to cell boundaries.
Incorrect assignments can blur the differences between cells and make it harder for researchers to identify distinct cell states or detect subtle changes in gene expression.
Correcting errors after cell segmentation
ResolVI is designed to work after a spatial transcriptomics dataset has already been segmented. Rather than assuming that every RNA molecule has been assigned to the correct cell, the model uses a probabilistic approach to account for possible assignment errors.
The researchers designed resolVI so that it can operate downstream of different segmentation methods. It also accounts for other sources of variation in spatial transcriptomics datasets, including batch effects, which are technical differences that can arise when samples are processed at different times or under different experimental conditions.
By modeling these sources of noise, resolVI produces a corrected representation of gene expression within individual cells.
Distinguishing closely related cell states
One advantage of improving RNA assignment is the ability to separate cell populations that may have only small differences in gene expression.
Cells belonging to the same general type can exist in different biological states. For example, an immune cell may become activated in response to a nearby signal while another cell of the same type remains inactive. The gene expression differences between those states may be relatively small.
Errors in assigning RNA molecules could obscure those differences. The researchers report that resolVI improved the ability to distinguish cell states and detect subtle spatial changes in gene expression.
This may be especially useful when researchers are attempting to discover previously unknown cell states rather than simply identifying cells using a predetermined set of known categories.
Combining spatial transcriptomics datasets
Another challenge in transcriptomics is comparing data generated from different experiments. Technical variation between samples can sometimes appear similar to genuine biological variation.
ResolVI incorporates correction for these nuisance factors and supports integrated analysis across datasets. The researchers found that the model improved analyses involving multiple spatial transcriptomics datasets while retaining biologically meaningful differences between cells.
As spatial transcriptomics technologies continue to generate increasingly detailed maps of RNA expression, computational methods that distinguish biological signals from technical errors will become increasingly important.
ResolVI is available as open-source software within the scvi-tools framework, allowing researchers to incorporate the method into existing spatial transcriptomics analysis workflows.
Availability – The code to reproduce the experiments of this paper is available via GitHub at https://github.com/YosefLab/resolvi-reproducibility.
Ergen C, Yosef N. (2026) ResolVI: addressing noise and bias in spatial transcriptomics. Nature Methods [Epub ahead of print]. [article]
Related Posts


Spatial transcriptomics allows researchers to measure gene activity while preserving information about where that activity occurs within a tissue. Unlike conventional RNA sequencing, which often analyzes RNA after cells or tissues have been mixed together, spatial transcriptomics can show which genes are active in particular cells and where those cells are located relative to their neighbors.
This spatial information can help researchers investigate how different cell types interact, how tissues are organized and how diseases alter the cellular environment. Newer spatial transcriptomics technologies can detect individual RNA molecules at resolutions approaching or even exceeding the size of a single cell. However, extracting accurate biological information from these measurements presents an important computational challenge.
Researchers at the University of California, Berkeley and the Weizmann Institute of Science have developed a computational model called resolVI to address one of these challenges.
Overview of resolVI
a, Schematic of the algorithm. To assign molecules to cells in ST, segmentation is performed. These algorithms do not fully capture the true cell shape. This leads to misassignment of molecules. In addition, unspecific background is present. Both phenomena contribute to the observed expression. The latent code of a cell and the contributions of ‘diffusion’ and ‘background’ to observed expression are estimated per cell using encoder networks. The latent code is decoded to yield the true expression. The mean observed expression is reconstructed as a sum over the estimated true expression, a weighted sum over the estimated true expression of neighboring cells to reconstruct diffusion and a per-sample background gene expression. We use a Poisson distribution for the background and a negative binomial distribution for diffusion and true expression (Methods). b, Plate model of resolVI. zn and zN(n) are the latent codes of the center cell and the neighboring cells, respectively, with N(n) being the neighboring cells of cell n. βnN(n) is the per-neighbor contribution, and denotes the gene expression of cells N(n). sn and ln are the sample ID and molecule count of cell n. and depend on the molecule count and sample ID. To simplify the plate model, the arrows are not displayed. yng is the total estimated gene expression due to diffusion summed over neighboring cells N(n), and bgsg is the estimated background of sample sn. Gray plates are latent parameters, while transparent ones are observed. In the semisupervised model, zn and zN(n) are dependent on the (partially) observed cell-type label of the respective cell-type label cn, and we additionally train a cell-type classifier that predicts cn from zn. c, Highlighted is a region of the mouse brain recorded with 10x Xenium. Displayed are the original 10x provided (left) and ProSeg (middle) segmentation. Molecules of cell-type marker genes are colored by their respective cell type. Black lines are segmentation boundaries, and cell shapes are colored by the estimated true proportion corresponding to the sum of background and diffusion, which are two distinct sources of nuisance. Right: the respective 4,6-diamidino-2-phenylindole (DAPI) image. We highlight one case of diffusion, where the boundary between an immune cell and a neuron is not clear, and one case of background, where a vascular cell contains sparse neuron-related transcripts.
Assigning RNA molecules to the correct cells
A spatial transcriptomics experiment can produce a map containing large numbers of RNA molecules distributed throughout a tissue section. To determine the gene expression profile of individual cells, computational methods first identify the boundaries of each cell, a process known as segmentation.
The RNA molecules located within those boundaries are then assigned to the corresponding cell. In principle, this produces a gene expression profile showing which genes are active in each individual cell.
In practice, cell boundaries are not always perfectly defined. Some RNA molecules may therefore be assigned to the wrong cell. These errors can be particularly important when neighboring cells have similar shapes or when RNA molecules lie close to cell boundaries.
Incorrect assignments can blur the differences between cells and make it harder for researchers to identify distinct cell states or detect subtle changes in gene expression.
Correcting errors after cell segmentation
ResolVI is designed to work after a spatial transcriptomics dataset has already been segmented. Rather than assuming that every RNA molecule has been assigned to the correct cell, the model uses a probabilistic approach to account for possible assignment errors.
The researchers designed resolVI so that it can operate downstream of different segmentation methods. It also accounts for other sources of variation in spatial transcriptomics datasets, including batch effects, which are technical differences that can arise when samples are processed at different times or under different experimental conditions.
By modeling these sources of noise, resolVI produces a corrected representation of gene expression within individual cells.
Distinguishing closely related cell states
One advantage of improving RNA assignment is the ability to separate cell populations that may have only small differences in gene expression.
Cells belonging to the same general type can exist in different biological states. For example, an immune cell may become activated in response to a nearby signal while another cell of the same type remains inactive. The gene expression differences between those states may be relatively small.
Errors in assigning RNA molecules could obscure those differences. The researchers report that resolVI improved the ability to distinguish cell states and detect subtle spatial changes in gene expression.
This may be especially useful when researchers are attempting to discover previously unknown cell states rather than simply identifying cells using a predetermined set of known categories.
Combining spatial transcriptomics datasets
Another challenge in transcriptomics is comparing data generated from different experiments. Technical variation between samples can sometimes appear similar to genuine biological variation.
ResolVI incorporates correction for these nuisance factors and supports integrated analysis across datasets. The researchers found that the model improved analyses involving multiple spatial transcriptomics datasets while retaining biologically meaningful differences between cells.
As spatial transcriptomics technologies continue to generate increasingly detailed maps of RNA expression, computational methods that distinguish biological signals from technical errors will become increasingly important.
ResolVI is available as open-source software within the scvi-tools framework, allowing researchers to incorporate the method into existing spatial transcriptomics analysis workflows.
Availability – The code to reproduce the experiments of this paper is available via GitHub at https://github.com/YosefLab/resolvi-reproducibility.
Ergen C, Yosef N. (2026) ResolVI: addressing noise and bias in spatial transcriptomics. Nature Methods [Epub ahead of print]. [article]
Related Posts
Recent Posts
 RNA sequencing reveals transcriptional allele differences in prostate cancer stem cells
 Unmasking “zombie cells” in aging tissue with an AI-powered barcode
 Villanova biology professor awarded NIH grant to advance understanding of RNA decay
 Eclipsebio expands its RNA characterization capabilities with multi-attribute nanopore-based sequencing assay eSTRAND RNA QC™
 Single-cell TimeLapse-seq reveals MTA is an essential retrotransposon
 RNA variant imaging for cancer diagnosis
RNA-Seq Products & Services


Stay Connected